Swing Trade Meaning: Swing Trading in the Stock Market Explained
A swing trade is a trade held for a few days to a few weeks to capture one "swing" in price: a move from a low point to a high point within a trend, or between support and resistance. Swing traders work mostly from daily charts, enter on a pullback or breakout, place a stop below the recent swing low, and exit at a target or when the move fades.
What does "swing" mean in trading?
Prices rarely move in straight lines. Even in a strong uptrend they move up, pull back, then move up again. Each leg is a swing. A swing trader tries to catch one leg rather than the whole trend (a position trader's goal) or tiny moves within a day (a scalper's goal).
| Intraday | Swing | Positional | |
|---|---|---|---|
| Holding period | Minutes to hours | 2 days to a few weeks | Weeks to months |
| Main chart | 5- or 15-minute | Daily (hourly for timing) | Daily or weekly |
| Overnight risk | None | Yes | Yes |
| Typical stop | 0.5–2% | 3–8% | 8–20% |
| Screen time | Most of the session | 30–60 minutes a day | A few hours a week |
Anatomy of a swing trade
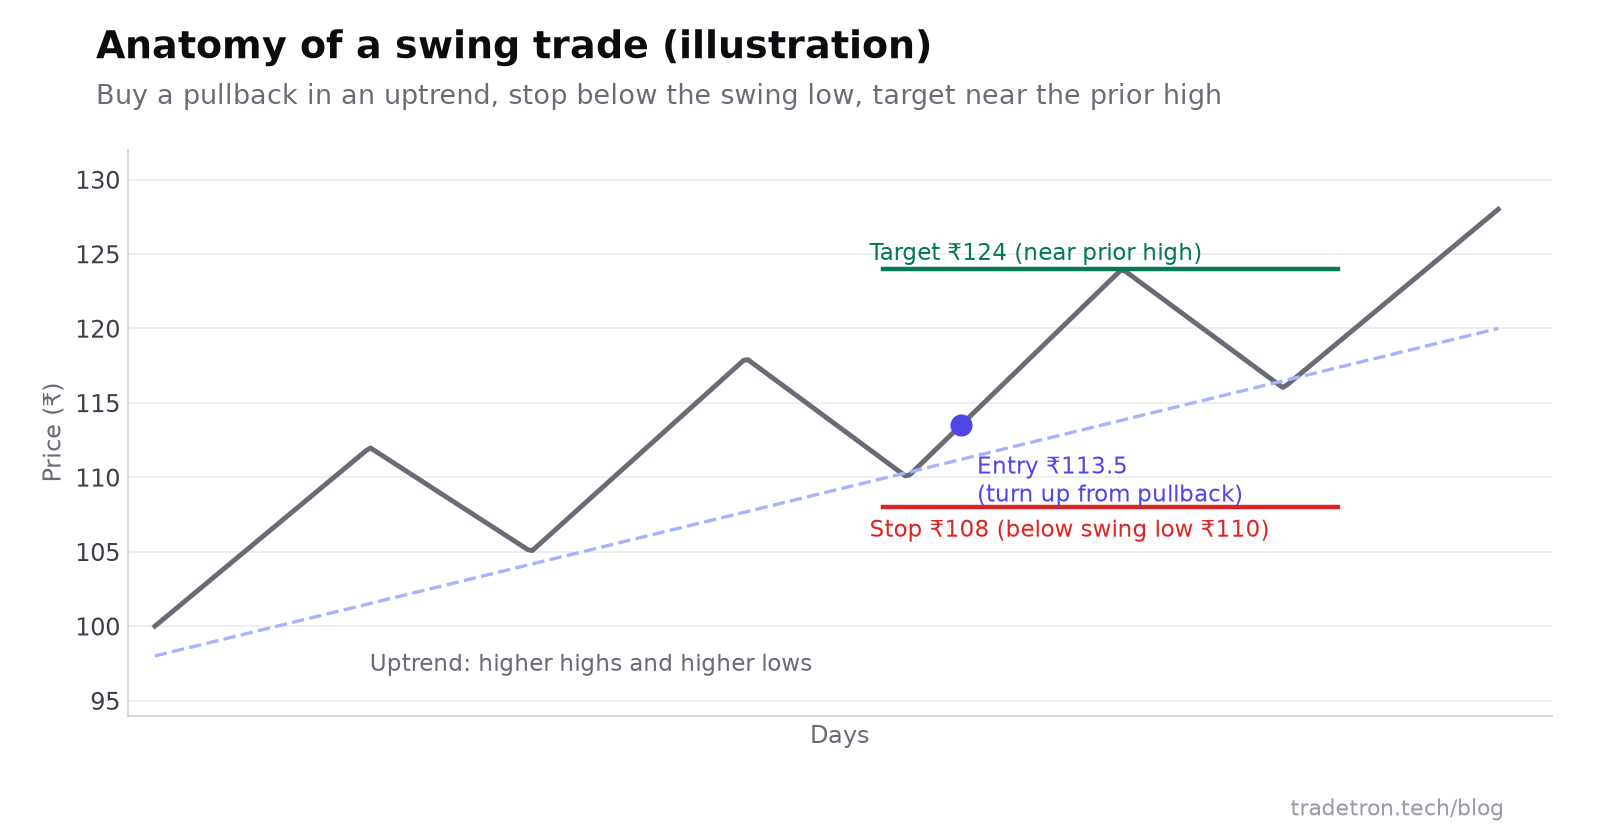 Illustration only, not real prices
In this illustration, the trade risks ₹5.50 per share (113.5 − 108) to make about ₹10.50 (124 − 113.5), a reward of nearly twice the risk. You can be wrong on half your trades and still come out ahead before costs, which is why swing traders care so much about where the stop and target sit.
Four common swing trading setups
1. Pullback in an uptrend
The stock is making higher highs and higher lows, usually above a rising 20- or 50-day moving average. You wait for a pullback towards that average or a prior support level, then buy when price turns up.
2. Breakout from a range
The stock has been stuck between two levels for weeks. You buy on a daily close above the top of the range, ideally on higher volume, with a stop back inside the range.
3. Bounce from support
Price drops to a level where it has bounced before. You buy when a bullish reversal candle forms there (for example a hammer or engulfing candle), with a stop just below the support.
4. Moving average crossover
A short average (say the 10- or 20-day EMA) crosses above a longer one (the 50-day). Simple and easy to automate, but it lags and gives false signals in sideways markets.
Indicators swing traders use
- Moving averages (20, 50, 200-day): trend direction and pullback levels.
- RSI (14): momentum; in an uptrend, pullbacks that hold RSI above 40 are common entry areas.
- MACD: momentum shifts on the daily chart.
- ATR (14): how far the stock usually moves, for placing stops (for example 1.5–2 × ATR).
- Volume: confirms breakouts.
Many of these are covered in best indicators for intraday trading; the same tools work on daily charts with swing settings.
Risk management for swing trades
- Place the stop where the setup is wrong, usually below the swing low or support, not at an arbitrary percentage.
- Size the position from the stop. Shares = rupees you'll risk ÷ (entry − stop).
- Aim for at least 1.5–2 times your risk before you take the trade.
- Account for gaps. Results, policy news and global moves can open the stock past your stop. Keep position sizes small enough that a gap hurts but doesn't wreck the account.
- Know when you'll exit if nothing happens. A time stop, such as exit after 10 trading days if the target isn't reached, frees capital from dead trades.
Pros and cons of swing trading
Pros
- Fits around a full-time job: analysis can be done after market hours
- Bigger moves per trade than intraday, so costs matter less
- Clear structure: entry, stop and target set before the trade
- Works in stocks, ETFs and index derivatives
Cons
- Overnight and weekend gaps can jump past your stop
- Choppy, sideways markets produce many small losses
- Requires patience: trades take days to play out
- Delivery charges (STT on buy and sell) are higher than intraday
Swing trading mistakes to avoid
- No stop because "it's only a few days". Gaps make stops more important, not less.
- Turning a failed swing into a long-term holding.
- Trading against the market trend with every setup.
- Too many open positions at once, all in the same sector.
- Chasing a stock after it has already run far above its moving average.
Automating swing trades
Swing trades have one awkward feature: the stop or target is often hit while you're at work. That makes them a natural fit for automation.
Compare styles in types of trading in the Indian stock market, or go longer with the position trading guide.
Frequently asked questions
What is the meaning of a swing trade?
A swing trade is a trade held for a few days to a few weeks to capture one move in price, such as a rise from a pullback low back to the previous high. It sits between intraday and positional trading.
How long do swing trades last?
Usually from two days to a few weeks. Many swing traders also use a time stop, exiting if the expected move hasn't happened within a set number of days.
Is swing trading good for beginners?
It's often easier than intraday trading because decisions are made on daily charts after market hours. Beginners still need a stop loss on every trade and small position sizes to handle overnight gaps.
Which timeframe is best for swing trading?
The daily chart is the standard for finding setups. Some traders use the hourly chart to time entries, and the weekly chart to confirm the bigger trend.
What is the difference between swing trading and positional trading?
Swing trades capture one move over days to weeks with tighter stops. Positional trades ride a whole trend over weeks to months with wider stops and fewer trades.
Can swing trading be automated?
Yes. On Tradetron you can set daily indicator entries, a stop loss and target on each position and a time-based exit, backtest them, and run them Live Offline before connecting a broker.