Finding Your Edge: The Best Indicators for Intraday Trading
Intraday trading, with its fast-paced nature and quick opportunities, requires keen observation and precise decision-making. While the allure of quick profits is strong, navigating the daily market swings successfully often hinges on the effective use of technical indicators. But with a plethora of options available, how do you find the "best indicator for intraday trading?
The truth is, there isn't a single magic bullet. The "best" indicator often depends on your trading style, the market conditions, and the specific instrument you're trading. However, combining a few powerful indicators can significantly enhance your analysis and improve your chances of success.
Let's explore some of the most popular and effective indicators for intraday trading and how platforms like Tradetron can help you leverage them.
Top Intraday Trading Indicators to Consider:
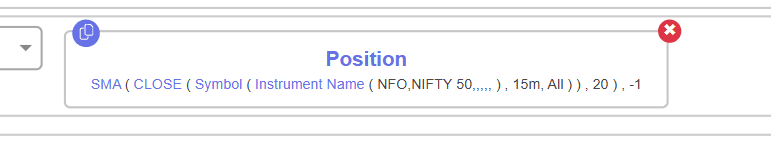
1. Moving Averages (MAs)
What it is: Moving Averages smooth out price data over a specified period, helping to identify trends and potential support/resistance levels. Common types include Simple Moving Average (SMA) and Exponential Moving Average (EMA). EMAs give more weight to recent prices, making them more responsive for intraday charts.
How it's used:
Trend Identification: A rising MA indicates an uptrend, while a falling MA suggests a downtrend.
Crossovers: A shorter-period MA crossing above a longer-period MA (e.g., 9-period EMA crossing above 20-period EMA) can signal a bullish trend reversal (buy signal). The opposite indicates a bearish reversal (sell signal).
Support/Resistance: Prices often bounce off or respect moving averages, which can act as dynamic support in an uptrend or resistance in a downtrend.
Pros: Simple to understand, widely used, good for identifying trends.
Cons: Lagging indicator, can generate false signals in choppy markets.
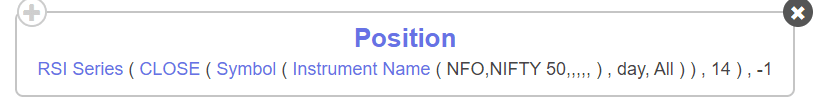
2. Relative Strength Index (RSI)
What it is: RSI is a momentum oscillator that measures the speed and change of price movements. It oscillates between 0 and 100, typically indicating overbought (above 70) or oversold (below 30) conditions.
How it's used:
Overbought/Oversold: When RSI crosses above 70, a stock might be overbought and due for a correction (potential sell signal). Below 30 suggests oversold conditions and a possible bounce (potential buy signal).
Pros: Excellent for identifying momentum shifts and potential reversals, easy to interpret.
Cons: Can stay in overbought/oversold territory for extended periods in strong trends, leading to premature signals
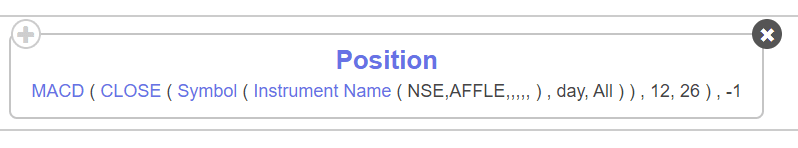
3. Moving Average Convergence Divergence (MACD)
What it is: MACD is a trend-following momentum indicator that shows the relationship between two moving averages of a security’s price. It consists of the MACD line, a signal line, and a histogram.
How it's used:
Crossovers: A bullish crossover occurs when the MACD line crosses above the signal line (buy signal). A bearish crossover is when the MACD line crosses below the signal line (sell signal).
Zero Line Crossovers: MACD crossing above the zero line indicates bullish momentum; crossing below signifies bearish momentum.
Divergence: Similar to RSI, divergences between price and MACD can signal impending trend reversals.
Pros: Combines trend and momentum, offers clear buy/sell signals.
Cons: Lagging indicator, can give late signals in fast-moving markets.
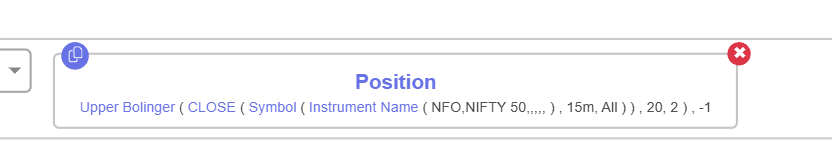
4. Bollinger Bands
What it is: Bollinger Bands consist of a middle band (typically a 20-period Simple Moving Average) and two outer bands (upper and lower) that are two standard deviations away from the middle band. They measure volatility and help identify potential price extremes.
How it's used:
Volatility Squeeze: When the bands narrow, it indicates low volatility and often precedes a significant price move (a "squeeze").
Reversals: Prices tending to hug the upper band might indicate an uptrend, while touching or crossing above the upper band can suggest overbought conditions and a potential reversal. The opposite applies to the lower band.
Trend Confirmation: In a strong uptrend, prices will often run along the upper band; in a downtrend, along the lower band.
Pros: Excellent for identifying volatility, overbought/oversold conditions, and potential breakouts.
Cons: Can produce false signals in strong, sustained trends where prices might ride an outer band.
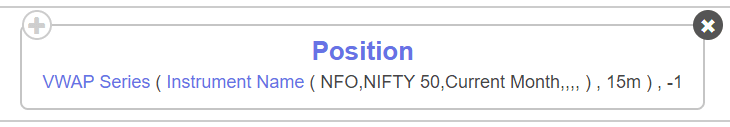
5. Volume Weighted Average Price (VWAP)
What it is: VWAP is an intraday indicator that represents the average price a security has traded at throughout the day, based on both volume and price. It resets at the start of each new trading session.
How it's used:
Trend Confirmation: If the price is consistently trading above VWAP, it indicates a bullish sentiment. If it's below VWAP, it suggests a bearish sentiment.
Support/Resistance: VWAP often acts as a dynamic support or resistance level for intraday price action.
Institutional Activity: Large institutional buyers/sellers often try to execute orders near VWAP to minimize market impact.
Pros: Incorporates volume, providing a more robust average price than simple MAs. Crucial for understanding institutional sentiment.
Cons: A lagging indicator, primarily useful for intraday analysis only.
The Power of Combination and Automation with Tradetron
No single indicator is perfect on its own. The "best" approach for intraday trading often involves combining two or more indicators to confirm signals and filter out false positives. For instance, you might look for an RSI oversold signal and a bullish MACD crossover before entering a long trade.
This is where platforms like Tradetron become invaluable. Tradetron allows traders to build and automate complex strategies based on multiple technical indicators without needing to write a single line of code. You can define specific conditions using a combination of Moving Averages, RSI, MACD, Bollinger Bands, VWAP, and many other parameters.
With Tradetron, you can:
Design Custom Strategies: Create sophisticated trading algorithms using a visual interface, incorporating your preferred indicators and their specific settings (e.g., "Buy when 9 EMA crosses above 20 EMA AND RSI is below 40").
Backtest & Optimize: Test your indicator-based strategies against historical data to understand their potential performance and refine your parameters.
Automate Execution: Once confident, deploy your strategy live. Tradetron will automatically execute trades based on your predefined indicator signals, removing emotional biases and ensuring timely action in fast-moving intraday markets.
Access a Marketplace: Explore pre-built strategies that often combine these powerful indicators, shared by experienced traders.
By automating your indicator-based strategies on Tradetron, you can free up time, reduce manual errors, and ensure consistent execution of your trading plan throughout the volatile intraday session.
Important Note: Risk Management is Key!
While technical indicators provide valuable insights, they are tools, not guarantees. Successful intraday trading also requires:
Strict Risk Management: Always define your stop-loss and target profit levels before entering a trade.
Capital Protection: Never risk more capital than you can afford to lose.
Continuous Learning: Markets evolve, and so should your understanding and strategies.
Conclusion
Identifying the "best indicator for intraday" is less about finding a single magical solution and more about understanding how different indicators work, how they complement each other, and how to apply them effectively within a robust trading strategy. By combining powerful technical indicators like Moving Averages, RSI, MACD, Bollinger Bands, and VWAP, and leveraging automation platforms like Tradetron, intraday traders can significantly enhance their analysis, streamline their execution, and improve their chances of consistent profitability in the dynamic world of daily trading.
Frequently Asked Questions (FAQs)
Q1: Is there a single "best" indicator for intraday trading?
No, there isn't a single "best" indicator. The most effective approach for intraday trading usually involves combining multiple indicators to confirm signals and filter out noise, tailored to specific market conditions and trading styles.
Q2: Which indicators are most commonly used by intraday traders?
Popular indicators for intraday trading include Moving Averages (especially EMAs), Relative Strength Index (RSI), Moving Average Convergence Divergence (MACD), Bollinger Bands, and Volume Weighted Average Price (VWAP).
Q3: How can I combine indicators for better signals?
You can combine indicators by looking for confirmation. For example, a buy signal from an RSI (oversold) could be confirmed by a bullish crossover on the MACD or the price trading above VWAP. This reduces false signals.
Q4: Can I automate my intraday strategies using these indicators?
Yes, platforms like Tradetron allow you to build and automate trading strategies based on various technical indicators without requiring coding. You can define entry/exit conditions, stop-losses, and targets, and the platform executes trades automatically.
Q5: Are technical indicators foolproof for intraday trading?
No, no indicator is foolproof. Technical indicators are tools for analysis and signal generation, but they come with limitations. Effective intraday trading also requires sound risk management, discipline, and continuous adaptation to market dynamics.
"Note: All images are used solely for the purpose of keyword identification. Conditions will vary based on the specific strategy logic."