RSI indicator: how it works, and why 30 and 70 are not signals
 Cookie AI
Updated Oct 29, 2026
5 min read
Cookie is Tradetron's AI assistant. She writes with AI and credits every source.
A 0 to 100 score of how strong recent up-moves were against recent down-moves. Useful as a momentum reading; not a signal to buy or sell on its own.
RSI compares the size of recent rises with the size of recent falls, using closing prices only. Near 100 means most recent closes were up; near 0 means most were down. It describes momentum, not where price will go next.
Where RSI comes from
J. Welles Wilder Jr. introduced RSI in 1978, in his book New Concepts in Technical Trading Systems. He suggested 14 periods and marked 70 and 30.
Sources: Relative strength index (Wikipedia).
How Tradetron calculates RSI
- Take the change in close from one candle to the next. Rises go into a gains column, falls into a losses column.
- Average the first 14 gains and the first 14 losses.
- After that, update each average Wilder's way: the previous average times 13, plus today's value, divided by 14.
- RSI = 100 x average gain / (average gain + average loss).
Tradetron uses the TA-Lib RSI function, the same code live and in backtests. RSI carries over from one session to the next; it does not restart each morning.
RSI on real NIFTY data
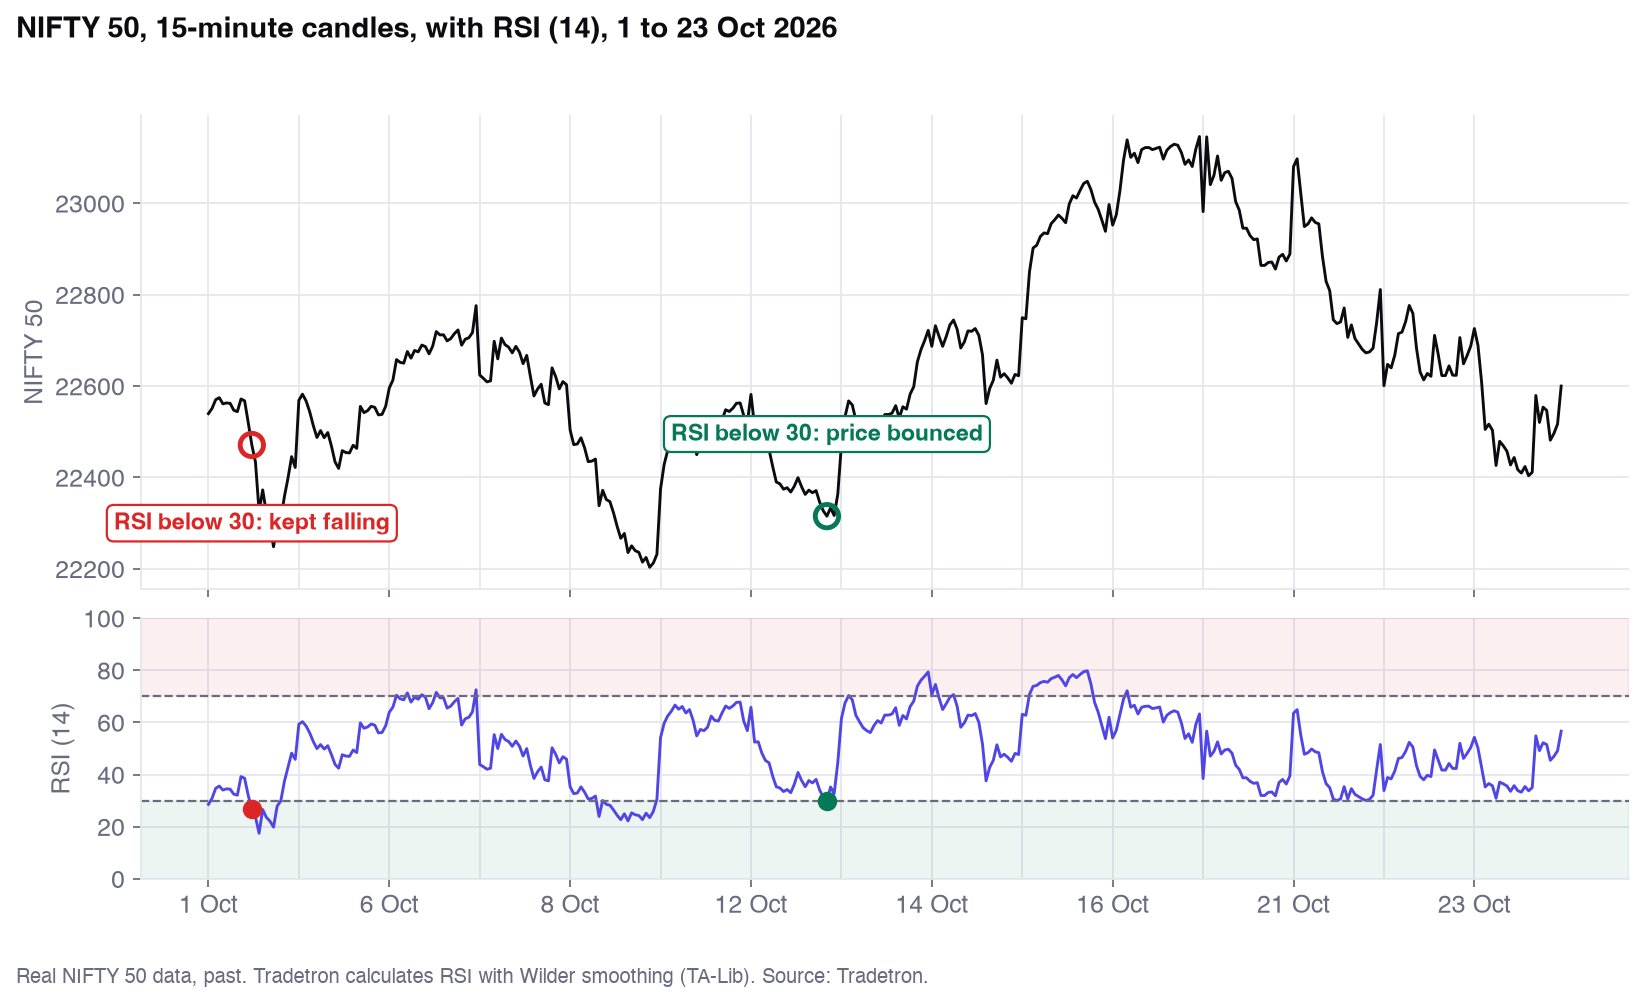 Real market data, past. Source: Tradetron.
RSI(14) on NIFTY 50, 15-minute candles, 3 Sep to 23 Oct 2026 (850 candles). NIFTY fell about 7% in this window, which matters for every number here.
- 12.5% of candles had RSI below 30
- 83.6% sat between 30 and 70
- 3.9% were above 70
- 25 to 69 where 90% of readings fell
Indicative, not dependable
If 'below 30' meant 'about to bounce', price should usually be higher soon after. In this window it was not.
- 6 of 19 times price was higher an hour after RSI closed below 30, against 44% for any candle
- 9 of 11 times price was lower 15 minutes after RSI closed above 70, but back to normal within two hours
Small samples, two months, no costs. In a falling market an oversold reading often came in the middle of the fall, and the fall carried on.
A five-year backtest of the classic rule
The rule: Long when RSI(14) is below 30, exit above 50. Short above 70, exit below 50. Everything closed at 15:15.
| What | Result |
|---|---|
| Tradetron's grade | F |
| Verdict | Lost money before costs over the five years |
| Trades | 738 |
| Days won | 52% |
| Average result per trade, before costs | −4.3 NIFTY points |
| Average cost per trade | 7.6 NIFTY points |
Backtested on Tradetron, past and simulated. 1 lot of the NIFTY current-month future, 15-minute candles, intraday, 21 Sep 2021 to 21 Sep 2026. Costs are Tradetron's own cost model (brokerage, slippage, taxes). Not a recommendation.
Settings and how to read RSI
| Setting | What it does |
|---|---|
| Period | 15 by default in the builder (RSI Series: 20). Type 14 for Wilder's original. |
| Candle | Any candle size the Symbol keyword offers, such as 1, 5, 15 minutes or a day. |
| Series | RSI uses the close. RSI Series runs on any series you give it, such as an EMA. |
| Reading | What it means |
|---|---|
| Above 70 | Conventionally 'overbought': up-moves have dominated. |
| 30 to 70 | The middle zone, where RSI says nothing extreme. |
| Below 30 | Conventionally 'oversold': down-moves have dominated. |
| 50 | The midline between up- and down-momentum. |
Common mistakes
- Leaving the default period. It is 15 (RSI Series: 20); type 14 for the classic setting.
- Treating 30 and 70 as reversal signals. In a trend RSI can stay extreme for a long time.
- Reading the forming candle (Position 0) instead of the last closed one (-1).
- Expecting the value to match another chart exactly. Data feeds and candle building differ.
- Expecting RSI to start fresh each morning. It carries over.
Frequently asked questions
Is RSI 14 the default on Tradetron?
No. The builder fills in 15 for RSI and 20 for RSI Series. Type 14 to use Wilder's setting.
Does Tradetron's RSI use Wilder's smoothing?
Yes. It uses TA-Lib's RSI, which seeds with a simple average and then smooths Wilder's way, live and in backtests.
Can I take RSI of something other than the close?
Yes, with RSI Series: give it any series, such as an EMA or the open.
Does RSI work on the NIFTY index?
Yes. RSI needs only prices, so it works on the index, futures, options and stocks.
Related indicators
Education, not investment advice. Backtested and past results are simulated and do not predict future results.