Contents
Algorithmic trading or algo trading is often seen as a risk-prone discipline. While the use of automated algorithms can help traders execute a large volume of trades without much input, it also opens them up to increased market risks. This makes it all the more important for you to regularly track and evaluate the performance of your algo trading portfolios.
Actively tracking your algo trading strategies can help you identify and solve small discrepancies before they cause major losses. It also helps you ensure that your strategies are in line with the latest market trends. But how exactly can you evaluate the performance of your algo trading strategies? Through performance metrics.
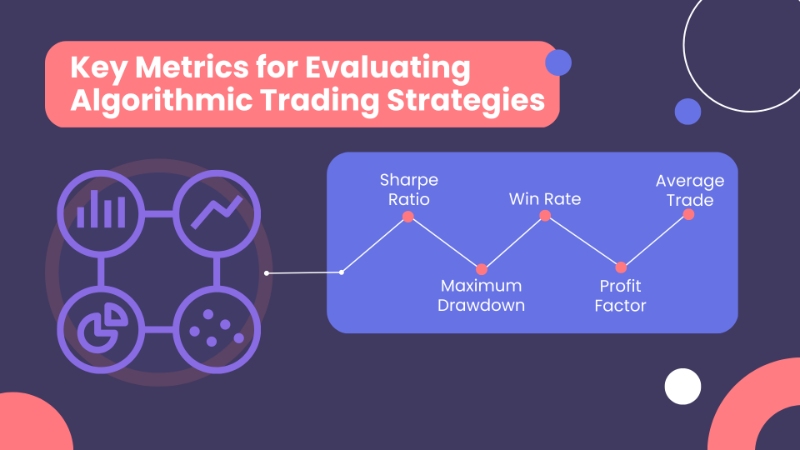
Key Metrics for Evaluating Algorithmic Trading Strategies

Traders can easily track the performance of their algo trading strategies by regularly evaluating a few key metrics associated with them. These include,
Sharpe Ratio
Maximum Drawdown
Win Rate
Profit Factor
Average Trade
Sharpe Ratio
The Sharpe Ratio is a measure of the risk-adjusted return of an investment strategy. It's calculated by subtracting the risk-free rate of return (such as the return on a government security or G-sec in India) from the expected return of the investment strategy and then dividing that difference by the standard deviation of the strategy's returns.
The Sharpe Ratio helps you determine whether the returns of a strategy are due to good investment decisions or just the result of taking on excessive risk. A higher Sharpe Ratio indicates a better risk-adjusted return, while a lower ratio suggests that the strategy may be too risky.
The formula for Sharpe Ratio is as follows:
Sharpe Ratio = (Rp - Rf) / σp
where:
Rp = average return of the investment
Rf = risk-free rate of return
σp = standard deviation of the investment's returns
A Sharpe Ratio of 1 or higher suggests that your portfolio is generating returns at a rate that is higher than the average risk-free asset, like a treasury bond. However, a Sharpe Ratio close to 0.5-0.6 is considered acceptable in most situations.
Maximum Drawdown
Maximum drawdown is a risk metric that measures the maximum loss an algorithmic trading strategy has experienced from its peak (highest portfolio value) to its trough (lowest portfolio value). It is used to evaluate the potential downside risk of a trading strategy and to help investors and traders understand the historical performance of the strategy.
Maximum drawdown can be seen as a measure of the potential downside risk of a trading strategy. The higher the maximum drawdown, the greater the potential loss an investor or trader could experience during a period of market volatility or adverse market conditions.
The formula for calculating maximum drawdown is
Maximum Drawdown = (Peak Value - Trough Value) / Peak Value
where "Peak Value" represents the highest value of the trading strategy over a certain period of time, and "Trough Value" represents the lowest value of the strategy during that same period.
Generally, a lower maximum drawdown is usually considered more desirable because it indicates that the investment or trading strategy has experienced less downside risk. However, some investors or traders may be willing to accept a higher maximum drawdown in exchange for the potential for higher returns.
Win Rate
Win rate is a performance metric that measures the percentage of profitable trades relative to the total number of trades executed by a trading strategy. It is a measure of a trading strategy's ability to generate profitable trades and is often used to evaluate the strategy's historical performance.
Win rate provides you with a measure of your trading strategy's ability to generate profitable trades. The higher the win rate, the greater the percentage of profitable trades generated by the strategy.
The formula for win rate is as follows:
Win Rate = (Number of Winning Trades / Total Number of Trades) * 100%
Where a winning trade is every trade that generates a net profit for your portfolio.
You should keep in mind that a high win rate alone does not guarantee a desirable trading strategy performance. It's important to also consider other performance metrics such as the average win size, average loss size, and risk-adjusted return.
In some cases, a lower win rate can be acceptable if the average win size is significantly larger than the average loss size. This is because a few large winning trades can offset many small losing trades, resulting in an overall profit for you.
Profit Factor
Profit factor is a performance metric used in algorithmic trading to measure the ratio of gross profits to gross losses generated by a trading strategy. It is calculated by dividing the sum of gross profits by the sum of gross losses.
Profit factor essentially measures your trading strategy's ability to generate profits. A higher profit factor indicates that the strategy has generated more profit relative to the amount of loss incurred, while a lower profit factor indicates the opposite.
A profit factor of 1 means that the strategy is breakeven, as the sum of gross profits equals the sum of gross losses. A profit factor greater than 1 is generally considered to be good because it indicates that the trading strategy generates more profit than loss.
Profit factor is measured using the formula,
Profit Factor = Gross Profit / Gross Loss
where "Gross Profit" represents the total profit generated by profitable trades, and "Gross Loss" represents the total loss generated by losing trades.
Average Trade
Average trade is a granular performance metric that measures the average profit or loss generated by each trade executed by an algo trading strategy. It is calculated by dividing the total profit or loss generated by the strategy by the number of trades executed.
Average trade measures the average profitability of each trade executed by the trading strategy. A positive average trade value indicates that your strategy generated a profit on average for each trade executed, while a negative average trade value indicates that the strategy generated a loss on average for each trade executed. In essence, average trade can be used as a measure of an algo trading strategy's ability to generate profit or incur a loss on each trade executed.
Average trade is calculated using the formula,
Average Trade = Total Profit or Loss / Number of Trades
where "Total Profit or Loss" represents the sum of all profits or losses generated by the trading strategy, and "Number of Trades" represents the total number of trades executed by the strategy.
Which performance metrics should you monitor?
Performance metrics serve as quantitative indicators that allow investors to easily monitor the performance of their portfolios based on pre-set parameters. While some metrics, like the Maximum Drawdown, allow investors to monitor the risks associated with an investment portfolio, others, like the Win Rate, are better suited for monitoring effectiveness. What metrics you choose to monitor and include in your performance reports depends entirely on your immediate investment goals, objectives, and philosophies. It is usually a good idea to give equal importance to risk-based and performance-based metrics to gain a holistic perspective on your portfolio’s overall performance.
Further, choosing the right metrics to gain deeper visibility into your investment portfolio is crucial for making informed investment decisions. While metrics such as returns and volatility are commonly used, it's important to consider other factors such as risk-adjusted returns, liquidity, and correlation with other assets. The Sharpe ratio, for example, helps investors assess the risk-adjusted performance of their investments. The Sortino ratio, on the other hand, provides a similar measure but focuses on downside risk. Additionally, metrics such as drawdowns, beta, and alpha can provide valuable insights into portfolio performance. By selecting and analysing a combination of these metrics, you can gain a more comprehensive understanding of your portfolio's strengths and weaknesses and make informed decisions on how to optimise your investments.
Importance of performance evaluation in algo trading
The high pace and volume of trades executed by algo trading programs magnify its ability to generate both profits and losses. This makes it important for you to notice and solve the smallest of discrepancies within your strategy. Regular performance evaluation can help you keep a close track of your strategy and ensure that you don’t take on a higher investment risk than necessary.
At Tradetron, we generate state-of-the-art algo trading testing and deployment models that help investors like you test all your algo trading strategies. Our models allow you to both backtest using historical market data and run live simulations against real-time market data. This ensures that all of your trading strategies are aptly tested before they’re put to work for you.
Visit us to learn more about who we are and how we empower investors.


 Made with Superblog