How to Build a Bullet-proof Algo Trading Strategy (8 Steps)
A bullet-proof algo trading strategy is one that survives conditions it wasn't tuned for. You build it by writing complete rules around a clear edge, capping risk on every trade and every day, testing on years of data with costs included, checking it isn't over-fitted, and running it Live Offline before real money. No strategy is loss-proof; a robust one keeps losses survivable.

Step 1: Define your objective
Before any rule, decide what the strategy is for. "Make money" is not an objective. These are:
- "Earn from option time decay on NIFTY, with a maximum loss of ₹5,000 a day."
- "Follow medium-term trends in 20 liquid stocks, holding for 2–6 weeks."
- "Rebalance a 10-stock portfolio monthly back to equal weights."
A clear objective tells you the market, timeframe, holding period and maximum acceptable loss. Those decide everything else.
| Objective | Typical holding period | What the strategy needs most |
|---|---|---|
| Intraday income from option decay | Hours | Tight risk limits, clean exits before close |
| Short-term momentum | Minutes to days | Fast, reliable execution and stops |
| Medium-term trend following | Weeks | Patience through many small losses |
| Portfolio rebalancing | Months | Low costs, discipline |
Step 2: Find an edge and the data to test it
An edge is a reason your rules should make money over many trades. Common sources:
- Trend following: prices that are moving tend to keep moving for a while. Example: buy when a 20-period average crosses above a 50-period average, exit when it crosses back.
- Mean reversion: prices stretched far from their average tend to come back. Example: buy when the price closes well below its lower Bollinger Band, exit at the middle band.
- Option premium decay: options lose time value as expiry nears, which sellers try to capture with hedged positions.
- Arbitrage: price gaps between related instruments, such as the same stock on NSE and BSE, or a future and its underlying. These gaps are small and close fast, so retail traders rarely capture them after costs.
To test any of these you need clean historical price data covering different market conditions: rising, falling, sideways, calm and volatile years. Economic data and news can explain why a period behaved the way it did, but most retail strategies are built and tested on price, volume and option data.
Step 3: Write complete rules
A strategy is only automatable, and only testable, when nothing is left to judgement. Every rule set needs:
This is an example of a complete rule set, not a recommendation or a tested result. Notice what it answers: what to trade, how much, when to enter, when to exit in profit, when to exit in loss, what happens at the end of the day, and when to stop for the day.
Step 4: Build risk management in, not on
Risk rules are what make a strategy bullet-proof. Every strategy will hit a losing streak; the question is whether the account survives it.
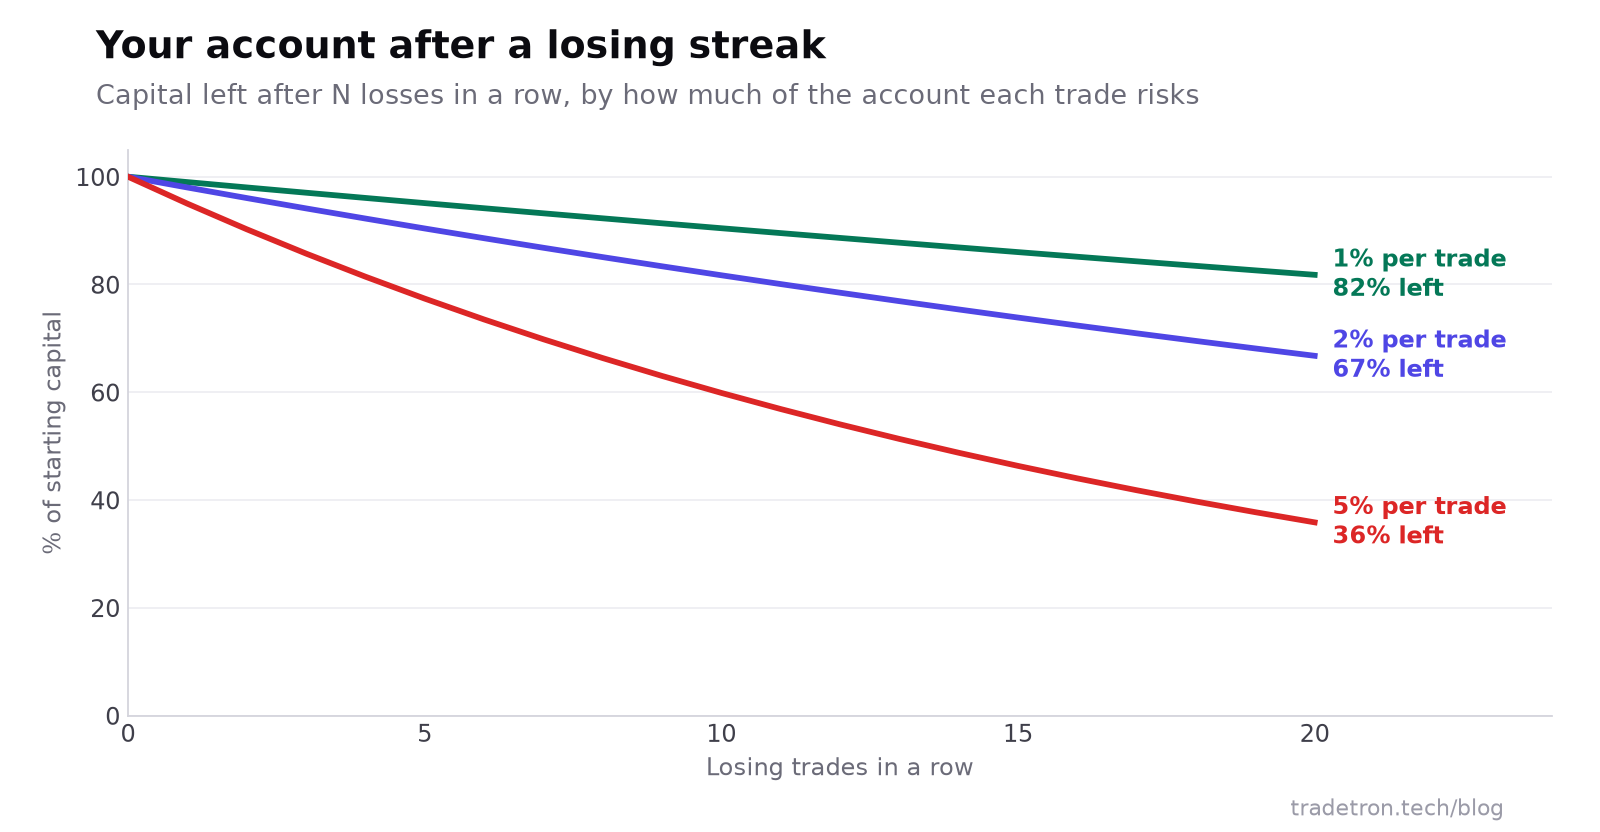 Capital left = (1 − risk per trade) raised to the number of losses
- 1–2% of capital at risk per trade is a common ceiling
- 82% of capital left after 20 straight losses at 1% risk
- 36% left after the same streak at 5% risk
The rules to set:
- Per-trade stop-loss on every position. Never move it further away.
- Position size from risk: decide the rupee loss you accept, divide by the stop distance, and round down to whole lots.
- Daily and overall loss limits for the whole strategy, so one bad day can't become a disaster.
- Leverage you can survive. Margin lets you take positions far bigger than your capital. Size for the worst week you can imagine, not the average one.
More techniques in seven ways to reduce drawdown and our trailing stop-loss guide.
Step 5: Backtest honestly
A backtest runs your rules on historical data. Done honestly, it is the cheapest way to throw out bad ideas.
- Use several years, including at least one difficult period for your style.
- Include charges and slippage. A strategy that trades often can turn from profit to loss on costs alone.
- Use the contract specs of the time. Lot sizes and expiry days have changed over the years (NIFTY is 65 units now; NSE expiries moved to Tuesday in 2025). Check your test handles them.
- Look at drawdown and losing streaks, not just total return. Could you have kept the strategy running through the worst stretch?
See how to evaluate a strategy's performance for the numbers to read.
Step 6: Check that it isn't over-fitted
Over-fitting is the main reason strategies that look perfect in testing fail live. You keep adjusting parameters until the past looks great, and the strategy ends up describing history rather than a lasting pattern.
- Change each parameter a little. If a 20/50 average works but 18/50 and 22/50 lose money, the result is luck.
- Hold back data. Build the strategy on one period and test it once on a later period you didn't look at.
- Test on related markets. A real trend rule on NIFTY should do at least reasonably on BANK NIFTY or large stocks.
- Count the rules. Every extra condition adds a chance to fit noise. Simpler usually holds up better.
- Check the trade count. Twenty trades prove very little. Look for a few hundred, or several years of a slower strategy.
Step 7: Run it Live Offline, then go live small
A backtest can't show how your strategy behaves with today's prices, today's liquidity and your broker's real order flow. Run it Live Offline for a few weeks: the strategy runs on live prices and records every trade, but nothing is sent to the exchange. Then compare those trades with what the backtest would have done on the same days.
When they match closely, go live at the smallest size and increase slowly. If live results drift, our guide on what to do when live algo trades don't perform as expected walks through the checks.
Step 8: Monitor and review
A robust strategy still needs supervision: broker sessions expire, margins change, orders get rejected, and markets shift. Review weekly:
- Did every trade match the rules?
- Is slippage in line with what you assumed?
- Is the drawdown within the range you saw in testing?
- Has anything changed in the market (lot size, expiry day, volatility) that the rules assume?
Change rules only for a reason you can explain, never because of the last three trades.
Frequently asked questions
What is the best strategy for algo trading?
There is no single best strategy. The best one for you has an edge you can explain, fits your capital and the time you can give it, and survives honest testing with costs included. Many retail traders start with trend-following or hedged option-selling rules because they are simple to define.
Is algo trading free?
Not entirely. Even when a platform has a free tier, you pay brokerage, exchange charges, taxes and slippage on every trade, and sometimes broker API or data fees. Include these costs in every backtest.
Is algo trading easy?
Setting up a basic automated strategy is easy with no-code tools. Building one that stays profitable is hard: it takes testing, risk control and ongoing review. Automation removes the manual work, not the thinking.
How do I know if my strategy is over-fitted?
Change its parameters slightly and test it on data you didn't use to build it. If small changes or new data turn a profit into a loss, it is probably over-fitted.
How much should I risk per trade?
Many traders cap risk at 1–2% of capital per trade. At 1%, twenty losses in a row still leave about 82% of the account; at 5%, only about 36%.
Which is the best algo trading platform in India?
It depends on what you need: some platforms focus on backtesting, others on execution or a strategy marketplace. Look for no-code building, honest backtesting, a test mode on live prices, support for your broker, and clear risk controls. Tradetron covers all of these.