

NIFTY 50 options, 1-minute replay
NIFTY option simulator: replay any minute since January 2020
Replay a real NIFTY options day, minute by minute. Pick a past session, trade a straddle or any other position from the chain as it stood, move the clock and read the P&L, payoff and Greeks as they were. NIFTY data starts on 1 January 2020 and runs in 1-minute steps, with a 35-day lag; SEBI requires 30. The tool below opens on NIFTY, and the preset days work without an account.
This page covers what is specific to NIFTY: how its lot size and expiry day changed, what an at-the-money straddle cost, and three days worth replaying. For the other indices see Bank Nifty and SENSEX. For the tool in general, see the option simulator hub.
One of the narrowest NIFTY sessions since 2024: 0.30% high-low range, India VIX 12.1. Shows option time decay when the index barely moves.
Option chain
| Calls | Strike | Puts | ||||||
|---|---|---|---|---|---|---|---|---|
| OI · chg | IV | LTP · Δ | Buy or sell call | Strike | Buy or sell put | LTP · Δ | IV | OI · chg |
| Pick a date and time to load the chain. | ||||||||
| Leg | Entry | LTP | P&L | Status | Actions |
|---|---|---|---|---|---|
| No position yet. Click B or S on any strike in the chain. | |||||
| Greek | Position | Means |
|---|---|---|
| No position yet. | ||
- Nothing yet. Every entry and exit is written here with its minute.
Want this to run without the clicking?
You've been trading this setup by hand. Tell us the logic, and Cookie will turn it into an algo you can backtest and review before anything goes live.
Historical replay for education and analysis. Past prices; not investment advice. Nothing here places orders.
See how this trade played out
Sign up free to keep replaying. Your trades come with you.
Already have an account? Log in
How the NIFTY chain works in the replay
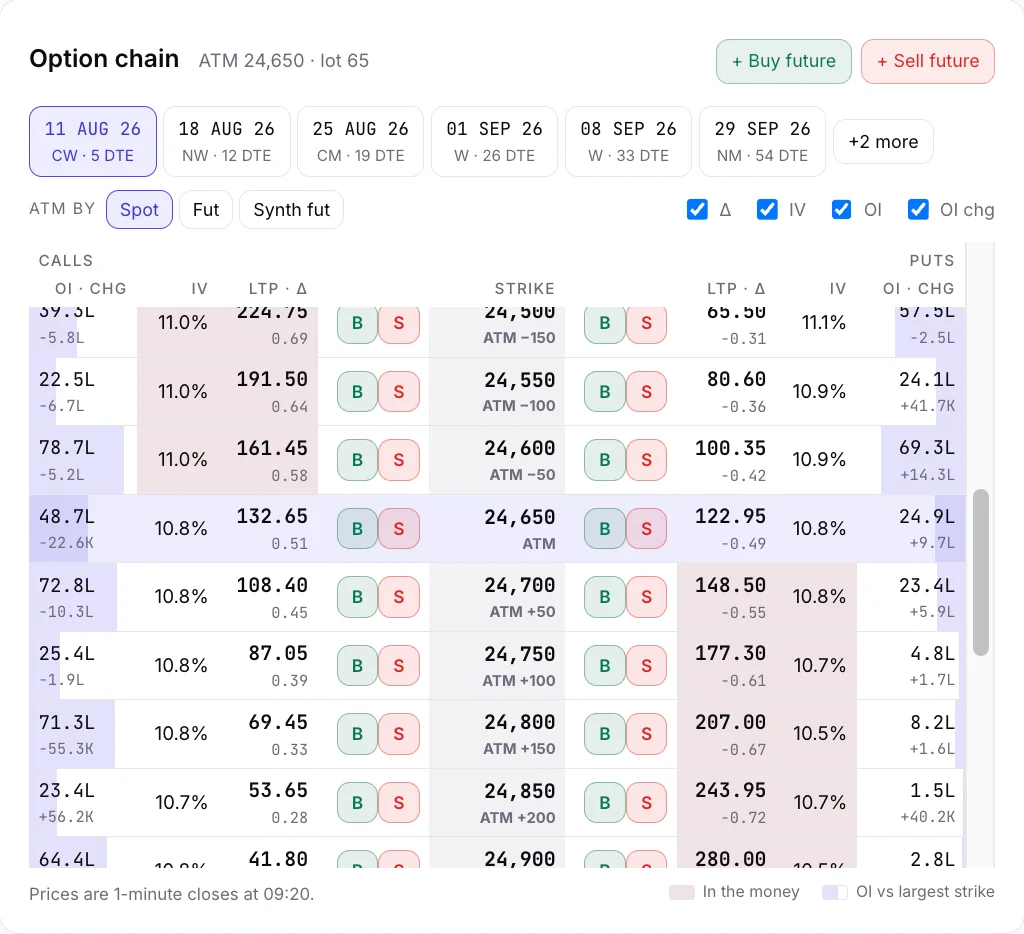
NIFTY strikes are 50 points apart. The chain shows 15 strikes either side of the at-the-money strike, so 750 points each way, with Delta, IV, OI and OI change beside every price. The expiry tabs list the contracts that were listed and traded on the date you chose, so a replay of 2021 shows 2021's weeklies, not today's.
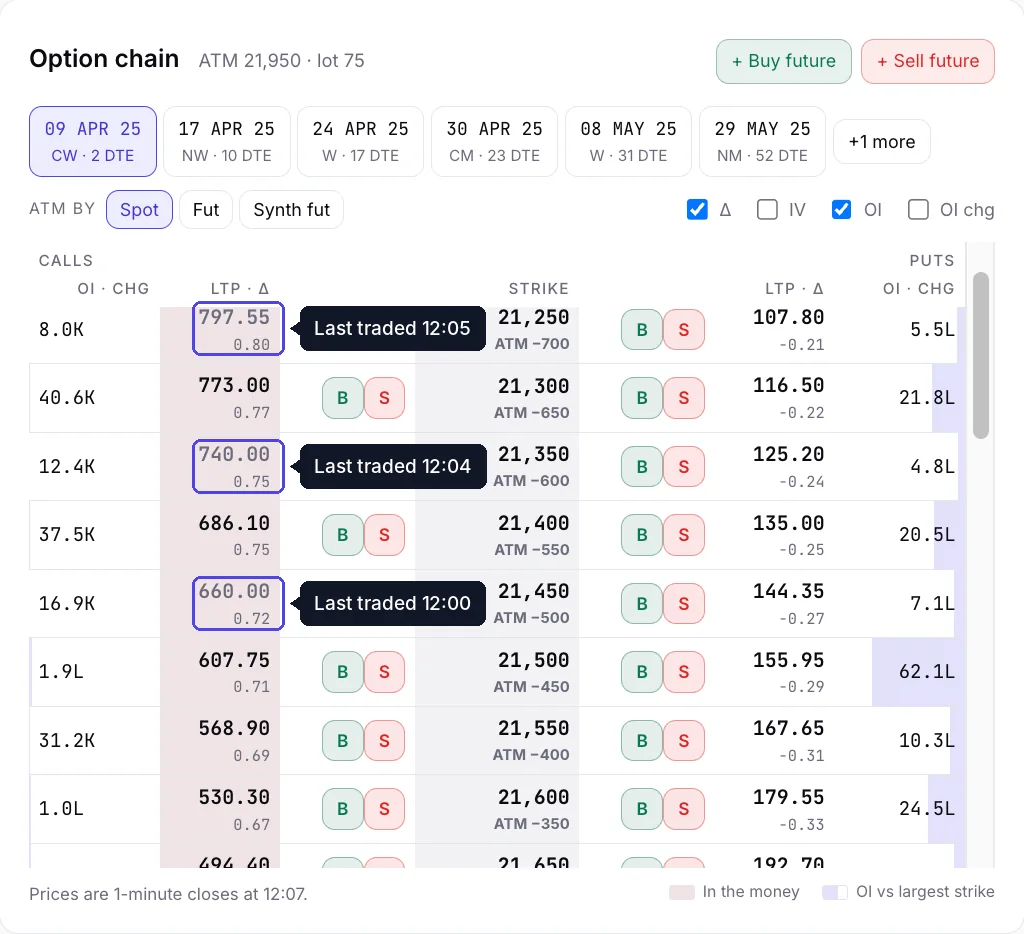
Every price is a traded price. If a strike did not trade in a minute you see its last price from earlier that day, greyed out, and we never fill a gap with a model. At the open and on far strikes you will meet greyed rows. That is the data, not a fault.
Your first NIFTY trade, in two clicks
Pick a preset day from the chips under the date bar. In the chain, click B on the call and B on the put at the middle row, the at-the-money strike. Each click adds one lot at that minute's price, and you now hold a long straddle. Click S instead to sell. Then move the clock and watch the position panel.

Without an account you can place trades and move the clock once. To keep going you sign up free, and your trades come with you.
NIFTY lot size history
A lot is not one number across the years. The replay sizes every leg by the lot of its own contract, keyed to the expiry date:
- 75 for contracts expiring up to 22 July 2021
- 50 for expiries from 29 July 2021 to 25 April 2024
- 25 for expiries from 2 May 2024 to 26 December 2024
- 75 for expiries from 2 January 2025 to 30 December 2025
- 65 for expiries from 6 January 2026
So a 2022 position is sized as a 2022 position was. The table follows exchange circulars and is keyed to expiry dates, so the few weeks when an old and a new lot traded side by side are not modelled.
NIFTY expiry history: Thursday, then Tuesday
Weekly NIFTY options were already running when our data starts on 1 January 2020. In our data the weekly expiry falls on a Thursday, every week, up to and including 28 August 2025. The first Tuesday expiry is 2 September 2025, and Tuesday has been the day since. The monthly contract moved with it: the last Thursday of the month up to August 2025, the last Tuesday from September 2025.
When the usual day is a market holiday the expiry moves earlier. NIFTY expired on Wednesday 9 April 2025, because 10 April has no trading in our data, and on Monday 30 March 2026, because 31 March has none. The expiry tabs in the replay are built from what actually traded on the day, so these shifts show up without any rule being applied. If you want to practise a specific weekday, the historical option chain guide explains how to find the expiry days in a month.
What a NIFTY at-the-money straddle cost, from our data
We measured this from our own prices. For each trading day from 1 January 2020 to 11 September 2026 (1,645 of 1,652 days had usable prices), we took the close of the 09:19 minute, the at-the-money strike, and the call and put of the nearest expiry that was at least a day away. Implied volatility is solved from both legs with Black-76 on the forward the pair implies, the same maths as the chain in the tool. Medians are shown, with the 10th to 90th percentile range in brackets.
- Implied volatility at 09:20, all days: 15.7% (10.3% to 27.0%)
- By year: 2020 22.6%, 2021 17.4%, 2022 19.2%, 2023 11.7%, 2024 14.8%, 2025 13.1%, 2026 so far 13.8%
- Straddle price, Thursday-expiry era from 2023 to 28 August 2025: 231 points, 1.08% of the index (0.70% to 1.63%)
- Same era, one day before expiry: 162 points (0.74%); four to seven days out: 298 points (1.32%)
- Tuesday-expiry era from 2 September 2025: 265 points (1.08%)
Multiply points by the lot to get rupees. For straddles four to seven days from expiry since September 2025, that comes to about 19,500 rupees per lot at the lot of the day. The price is the premium of both legs together, not a forecast of anything. Years differ a lot: the median straddle was 1.55% of the index from 2020 to 2022, against 1.08% since 2023, so compare days with similar volatility, not similar dates.
Three NIFTY days to replay
6 August 2026: a calm session
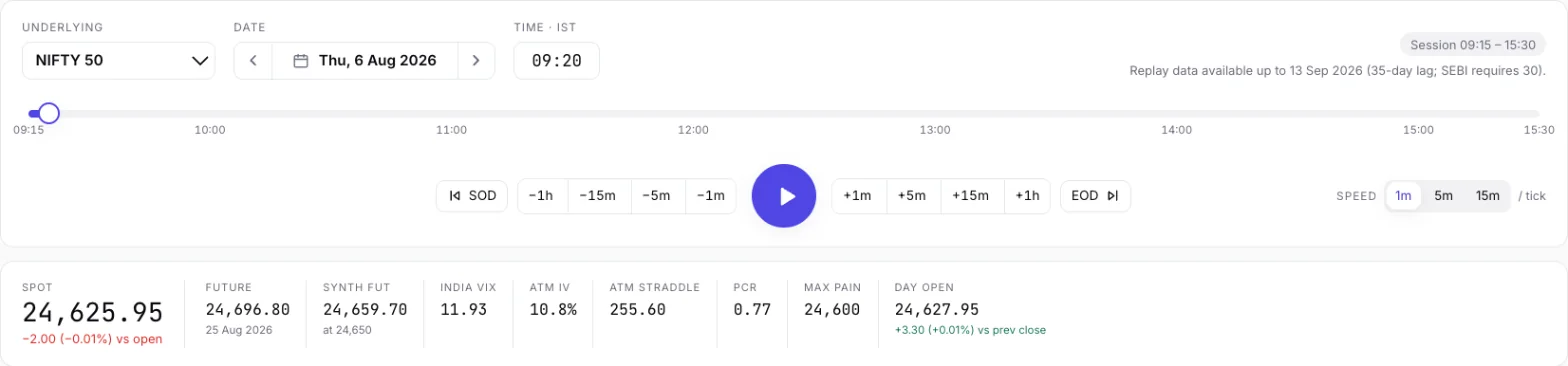
NIFTY opened +0.01% and closed +0.05% inside a 0.30% range, with India VIX at 12.1. At 09:20 the 24,650 straddle for the 11 August expiry, five days out, was priced at 255.6 points, 1.04% of the index, at an implied volatility of 10.8%. Replay it to see how little the chain moves when the index sits still, and compare the Greeks at 09:20 with those at 14:00. Open 6 August 2026 at 09:20.
15 May 2025: a Thursday expiry day
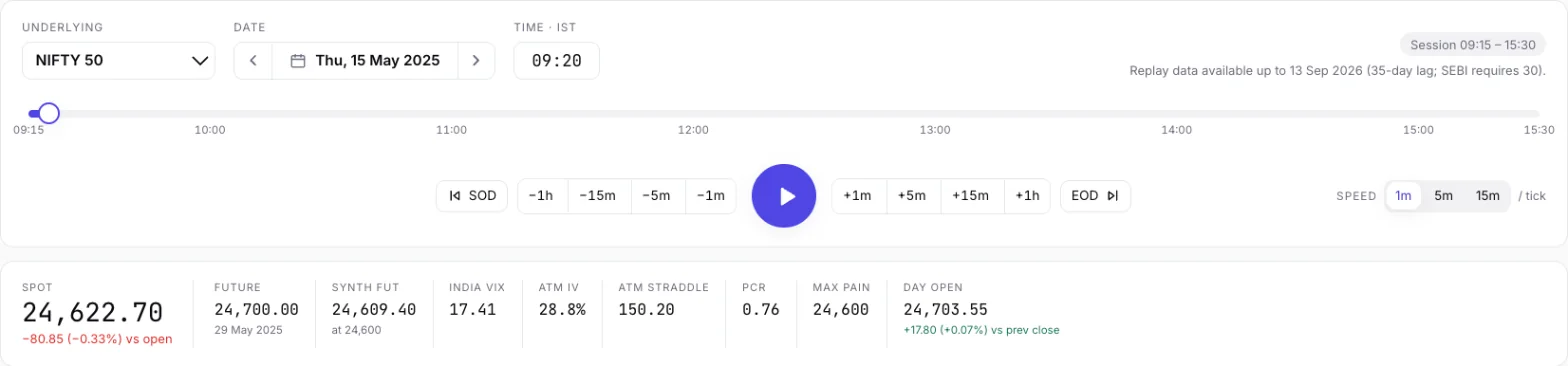
The weekly contract expired that afternoon. NIFTY opened +0.15%, ranged 2.52% and closed +1.60%. At 09:20 the 24,600 straddle of that day's own contract was priced at 150.2 points (0.61%), while the same strike a week out was priced at 439.8 (1.79%). Replay it to see two contracts on one screen behaving very differently. Open 15 May 2025 at 09:20.
7 April 2025: a volatility spike
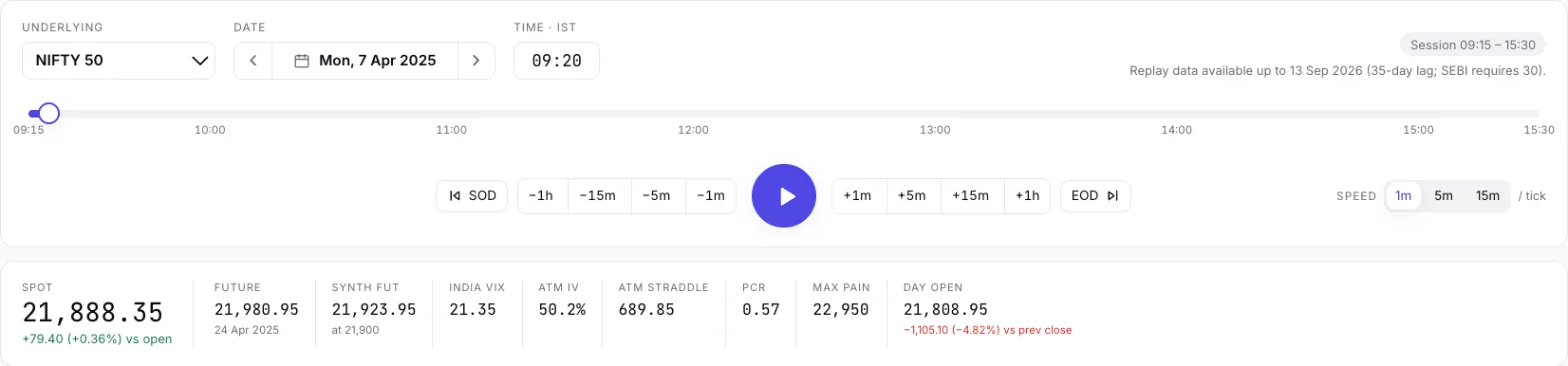
NIFTY gapped down 4.82% at the open and India VIX rose 66.1% on the day, the largest one-day rise in our data. The index then recovered 1.99% from the open and closed 2.89% below the previous close. By 09:20 the 21,900 straddle for the 9 April expiry was priced at 689.8 points, 3.15% of the index, an implied volatility near 50%. Start at 09:15 to trade the open itself. Open 7 April 2025 at 09:15.
After the replay
A trade you can describe in rules can become an algo. Tell Cookie your entry time, your strikes as distance from the at-the-money strike, and how you exited. Cookie writes the algo, you backtest it on years of data, and you deploy it with your broker when you are ready. Algo trading carries risk, and a backtest describes the past. The manual replay to algo guide walks through a straddle step by step. To read a payoff before you place a leg, see the payoff graph guide.
Questions traders ask
What is the NIFTY lot size in the simulator?
It depends on the contract. The replay uses the lot in force for each contract's expiry: 75, 50, 25, 75 and now 65 for contracts expiring from 6 January 2026. The full list is on this page, under lot size history.
Which day does the NIFTY weekly expire in the replay?
Thursday through 28 August 2025, and Tuesday from 2 September 2025. When the usual day is a market holiday, the expiry moves to the previous trading day, and the expiry tabs show that.
How far back does the NIFTY data go?
To 1 January 2020, in 1-minute steps. The most recent replayable day is 35 days old; SEBI requires 30. The preset days work without an account, and a free Tradetron login opens every trading day.
Can I replay a NIFTY expiry day?
Yes. Open 15 May 2025, a Thursday expiry, and compare the same-day contract with the next week's. Signed in, you can replay any expiry day since 2020.
Why does the chain show just some NIFTY strikes?
The chain shows 15 strikes either side of the at-the-money strike, which is 750 points each way at a 50-point step. The window keeps the chain readable on a phone. In the preset days a leg you bought stays priced even after the index has moved out of the window.
Is the NIFTY data adjusted or modelled?
No price is modelled. Each price is a traded price from the minute you are on, and a strike with no trade in that minute shows its last price, greyed. Implied volatility and Greeks are calculated from those traded prices.
Keep reading
- Free NIFTY & Bank Nifty option simulator: replay a real day
- Bank Nifty option simulator
- SENSEX option simulator
- Historical option chain data, explained
- How to practise options trading with replay
- The option payoff graph, explained
- From manual replay to algo
Historical replay for education and analysis. Past prices; not investment advice. Nothing here places orders. Algo trading carries risk.