

Guide
The option payoff graph, explained with worked examples
An option payoff graph is a picture of one question: if the index ends at this level, how much does my position gain or lose? The horizontal axis is the index level. The vertical axis is the result per unit, or per lot once you multiply by the lot size. A line crosses zero where you break even, and its shape tells you what you have bought or sold before you place a single order.
This guide builds the graph by hand for a long call and a short straddle, then explains the two lines most tools draw, the bands around them, and the mistakes that make people misread the picture. If you would rather draw yours with a form, use our payoff calculator. To see a payoff line change as the clock moves on a real day, use the option simulator.
How to read any payoff graph in three steps
- Find the flat parts. A flat part at the bottom is a capped loss. A flat part at the top is a capped gain. A line that keeps falling or rising at the edge is risk or gain with no cap.
- Find where it crosses zero. Compare each breakeven with the current index level. How far away are they, in points and in percent?
- Ask which line you are looking at. Expiry, or a target time before expiry? The answer changes the shape.
Spend a minute on those three questions before you look at any number. Most misreadings come from skipping them, such as reading a capped loss as a small loss or a breakeven as a safe level.
What the graph shows
Every point on the line answers the same question for a different index level at expiry. Three things to look for:
- Breakeven points. Where the line crosses zero. On one side of a breakeven the position shows a gain at expiry, on the other a loss.
- The cap on the left and right. A bought option can lose at most the premium paid, so the line goes flat below zero. A sold option has a flat top at the premium received, and the line falls away from there.
- The slope. A slope of 1 means the position moves one-for-one with the index. A slope of 0 means the index level no longer matters. Flat parts are the cap. Steep parts are where the risk or gain builds.
This is arithmetic on strikes and premiums. It does not know what the index will do.
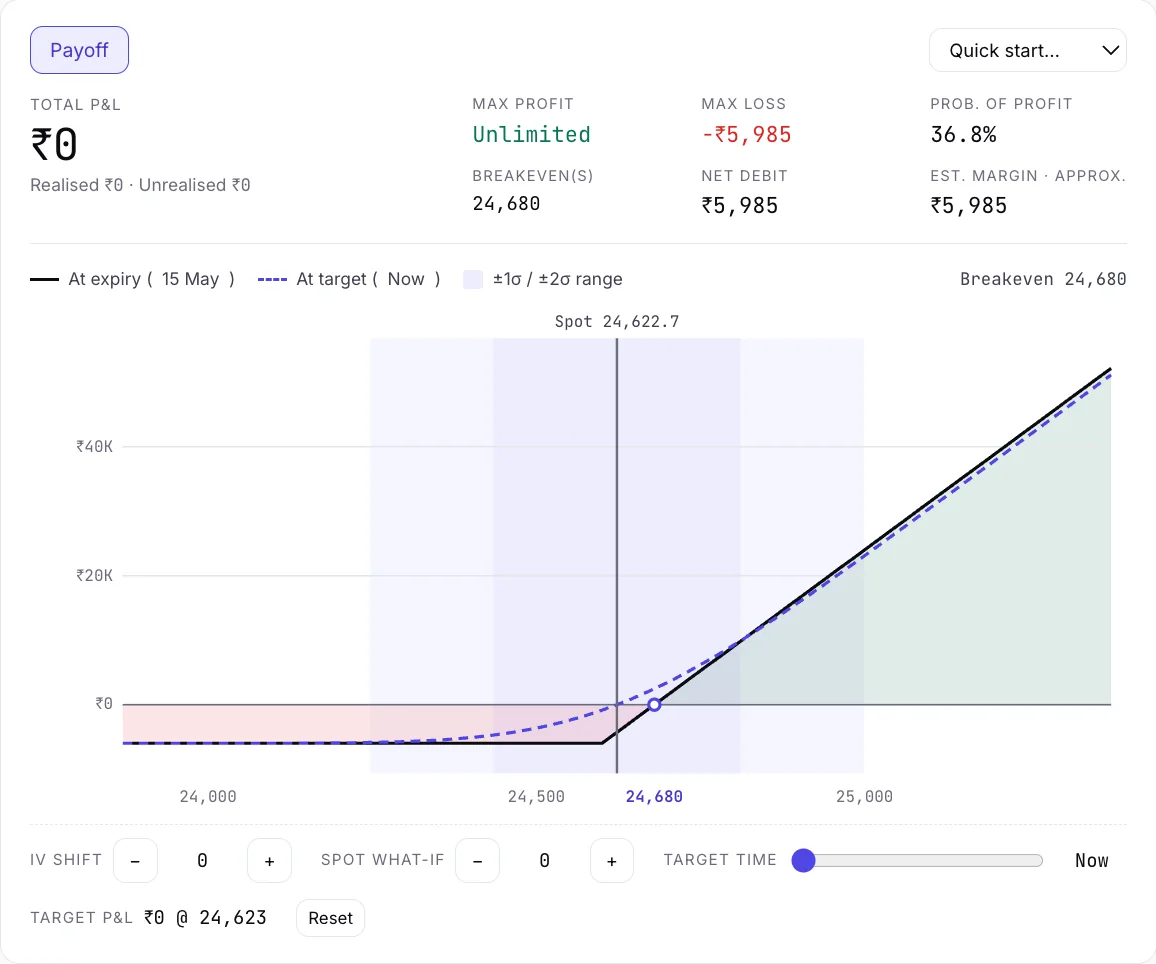
How to calculate the payoff of one option
At expiry, an option is worth its intrinsic value and nothing else. For one unit:
- Call, at index level S and strike K: intrinsic value = the larger of (S − K) and 0.
- Put: intrinsic value = the larger of (K − S) and 0.
- Payoff for a buyer = intrinsic value − premium paid. For a seller = premium received − intrinsic value.
Multiply by the lot size to get the amount per lot. Exchanges revise lot sizes, so use the one your broker shows today rather than one from memory.
Worked example 1: a long call (illustration)
The numbers are made up for the example. They are not from a real day.
Say the index is at 24,000 and you buy the 24,000 call for a premium of 120 per unit.
- Index at 23,800 at expiry: the call expires worthless. Result: −120. This is the worst case, the premium.
- Index at 24,000: still worthless. Result: −120.
- Index at 24,120: intrinsic value is 120. Result: 0. This is the breakeven, strike plus premium.
- Index at 24,300: intrinsic value is 300. Result: +180.
Plot those four points and you get a line that is flat at −120 up to 24,000 and then climbs one-for-one. That bend at the strike is the hockey-stick shape you see in every long-option diagram.
Worked example 2: a short straddle (illustration)
Again, invented numbers. Index at 24,000. You sell the 24,000 call at 120 and the 24,000 put at 110. The premium received is 230 per unit.
The payoff at expiry is 230 minus how far the index finished from 24,000, in either direction.
- Index at 24,000: result +230, the highest point on the graph.
- Index at 24,230 or 23,770: result 0. These are the two breakevens, the strike plus and minus the premium.
- Index at 24,500 or 23,500: result −270.
The graph is an upside-down V. It peaks at the strike, falls away on both sides and has two breakeven points. The loss is not capped on either side, which is why short straddles come with exits. That is also why the graph is useful: it shows the risk you would not see from the premium alone. For how a hand-made exit becomes a stop-loss rule, see from a manual replay to an algo.
Combining legs
For a multi-leg position, add the payoffs of each leg at every index level. A bull call spread, a long call at a lower strike and a short call at a higher one, adds a rising line to a falling line and ends with a flat top and a flat bottom. An iron condor adds four options and gives a shape with a flat top in the middle and flat floors on both outer sides. You do not have to do the arithmetic by hand. The calculator and the simulator both add the legs for you. Understanding why the shape looks the way it does is what lets you spot a position you did not mean to build.
Expiry line and target-time line
The graph above is the expiry payoff. Before expiry, an option still holds time value, so today's result at a given index level differs from the expiry result. Many tools draw a second, smoother line for a chosen earlier time, called the target-time line. Where it sits above or below the expiry line tells you how much of the position's value is time value.
Tradetron's replay draws both. You pick a target time on the day and the line moves. On an expiry day, such as 15 May 2025, move the target slider from the start of the day (+0.0) to about +0.2 days, which is mid-afternoon, then to Expiry, and watch the target-time line close in on the expiry line. The gap shrinking is time decay on the screen.
Target ≈ 10:00
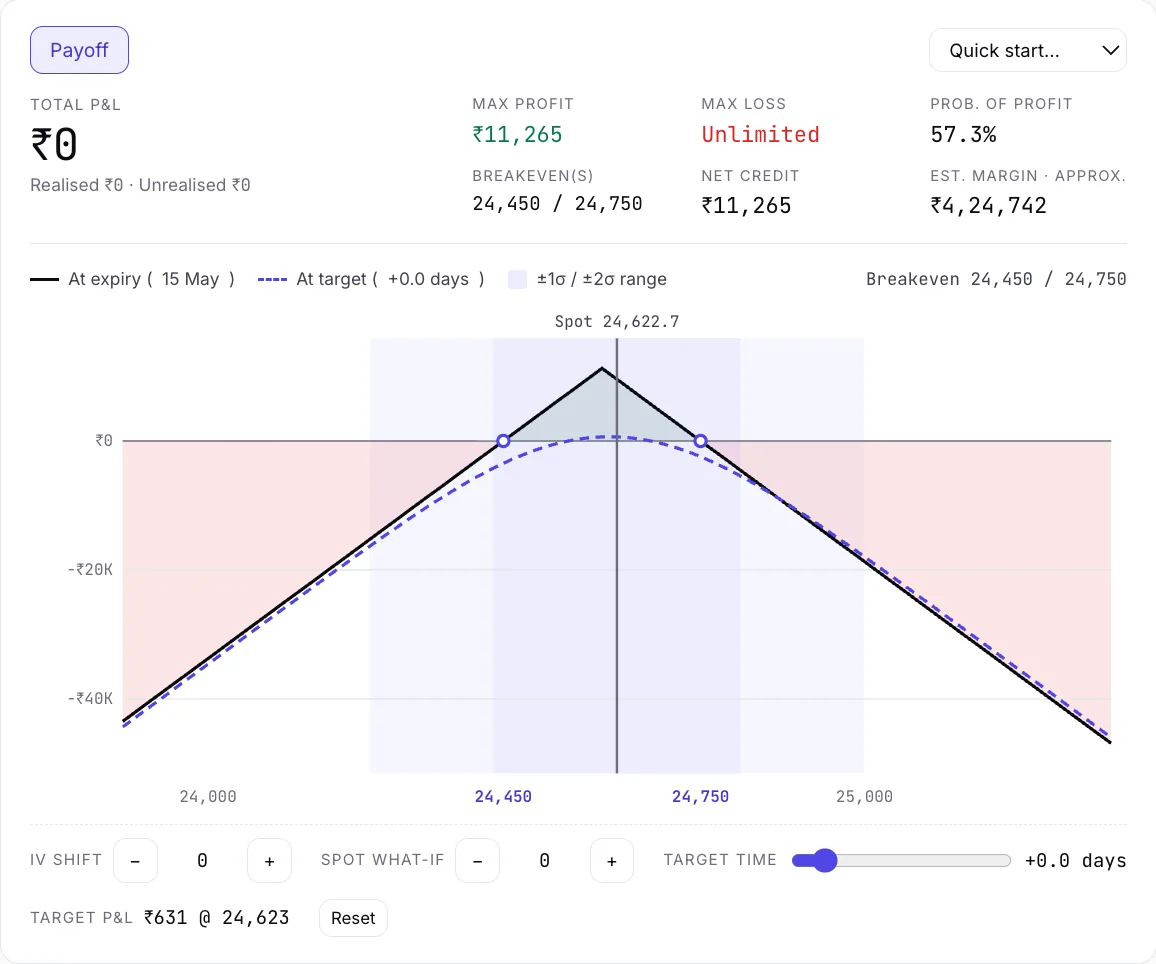
Target slider near the start of the day: the dashed target line sits well below the expiry line near the strike.
Target ≈ 14:00
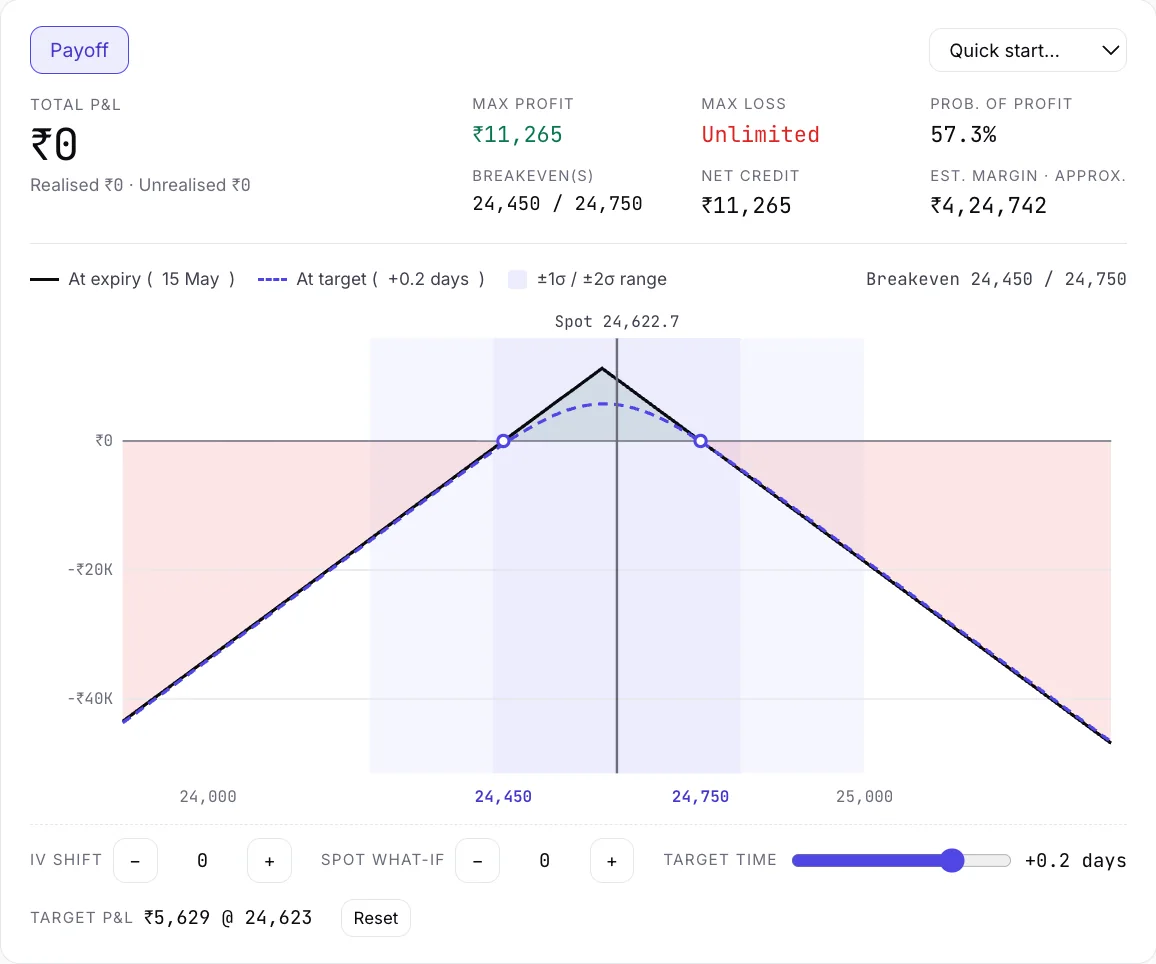
Target slider at about 14:00 (the slider reads +0.2 days): most of the gap has gone.
Target 15:30
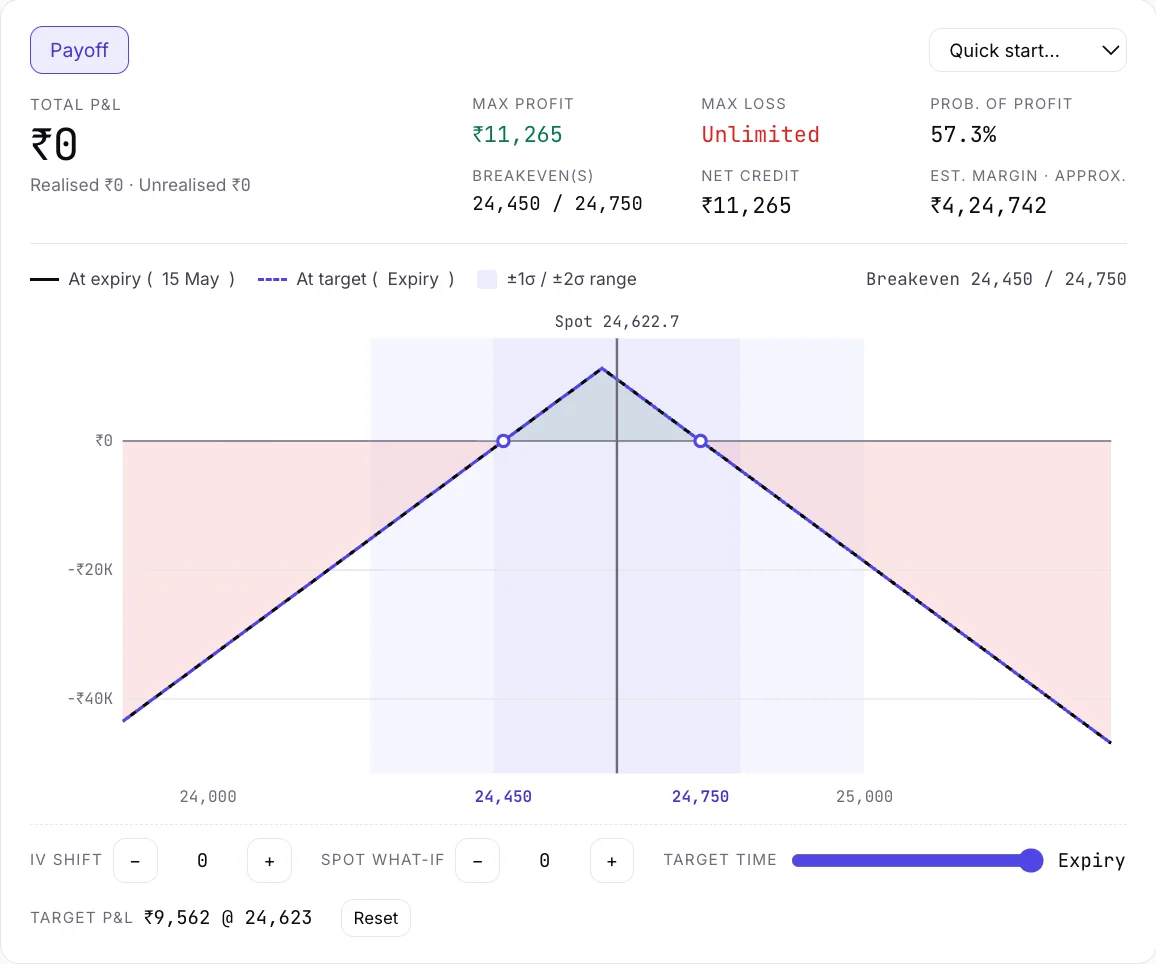
Target at expiry: the two lines are the same line.
The bands: ±1σ and ±2σ
The σ bands shade the range the index could plausibly cover, based on the volatility the market is pricing in. Under the model's assumptions, the index would finish within one sigma about two times in three, and within two sigma about 19 times in 20. The bands are a way to put your breakevens in context: are they inside the expected range, or well outside it? They are a model's view, not a guarantee, and real moves can be larger than a model implies.
The simulator also has what-if controls for the index level and for IV, so you can see how the curve changes if either moves.
Common mistakes
- Reading the expiry line as today's result. It is what happens if you hold to expiry.
- Forgetting the lot size. The graph per unit looks small. Multiply by the lot.
- Ignoring costs. The arithmetic here ignores brokerage, taxes and slippage. They matter most for positions with several legs.
- Judging a position by its highest point. The peak of a short straddle is the most pleasant number on the graph and the least likely one. Look at the sides.
- Ignoring margin. A payoff graph says nothing about the margin a position needs. Check that with your broker.
- Treating the graph as a forecast. It describes outcomes, not odds.
Try it on a real day
Open NIFTY on 15 May 2025, the weekly-expiry day. Build the short straddle from the NIFTY option simulator's quick starts and look at the two lines. Step the clock. For the numbers behind the screen, historical option chain data, explained covers what each column of the chain means, and practising options trading with replay gives a routine for the session.
Questions traders ask
What is a payoff graph?
A chart that shows how much an option position gains or loses for each possible index level at expiry. The horizontal axis is the index, the vertical axis is the result, and the point where the line crosses zero is the breakeven.
How to calculate payoff of option?
For a call, the payoff at expiry is the larger of (index − strike) and 0, minus the premium you paid. For a put, use (strike − index). A seller reverses the sign. Multiply by the lot size for the amount per lot.
How to make a payoff diagram?
List the index levels you care about, calculate each leg's payoff at each level, add them and plot the total. Or enter your legs into the payoff calculator, or build the position in the option simulator and read the payoff there.
What do breakeven points mean on a payoff graph?
They are the index levels at which the position's result is zero at expiry. A long call has one, at the strike plus the premium. A short straddle has two, at the strike plus and minus the combined premium.
Why does the payoff curve look different before expiry?
Before expiry an option still has time value, so the result at a given index level is smoother than at expiry. As expiry approaches, the target-time line moves toward the expiry line.
What are the sigma bands on the payoff chart?
They show the range the index could cover under the volatility the market is pricing in: about two in three outcomes inside one sigma, and about 19 in 20 inside two. They are a model's estimate, not a forecast.
Does a payoff graph include brokerage and taxes?
Not unless the tool says so. The arithmetic uses strikes and premiums. Costs, slippage and margin are separate, so check them with your broker.
Keep reading
- Free NIFTY & Bank Nifty option simulator: replay a real day
- NIFTY option simulator
- Historical option chain data, explained
- Practice options trading with replay
- From a manual replay to an algo
- Option simulators in India, by use case
Historical replay for education and analysis. Past prices; not investment advice. Nothing here places orders. Algo trading carries risk.