

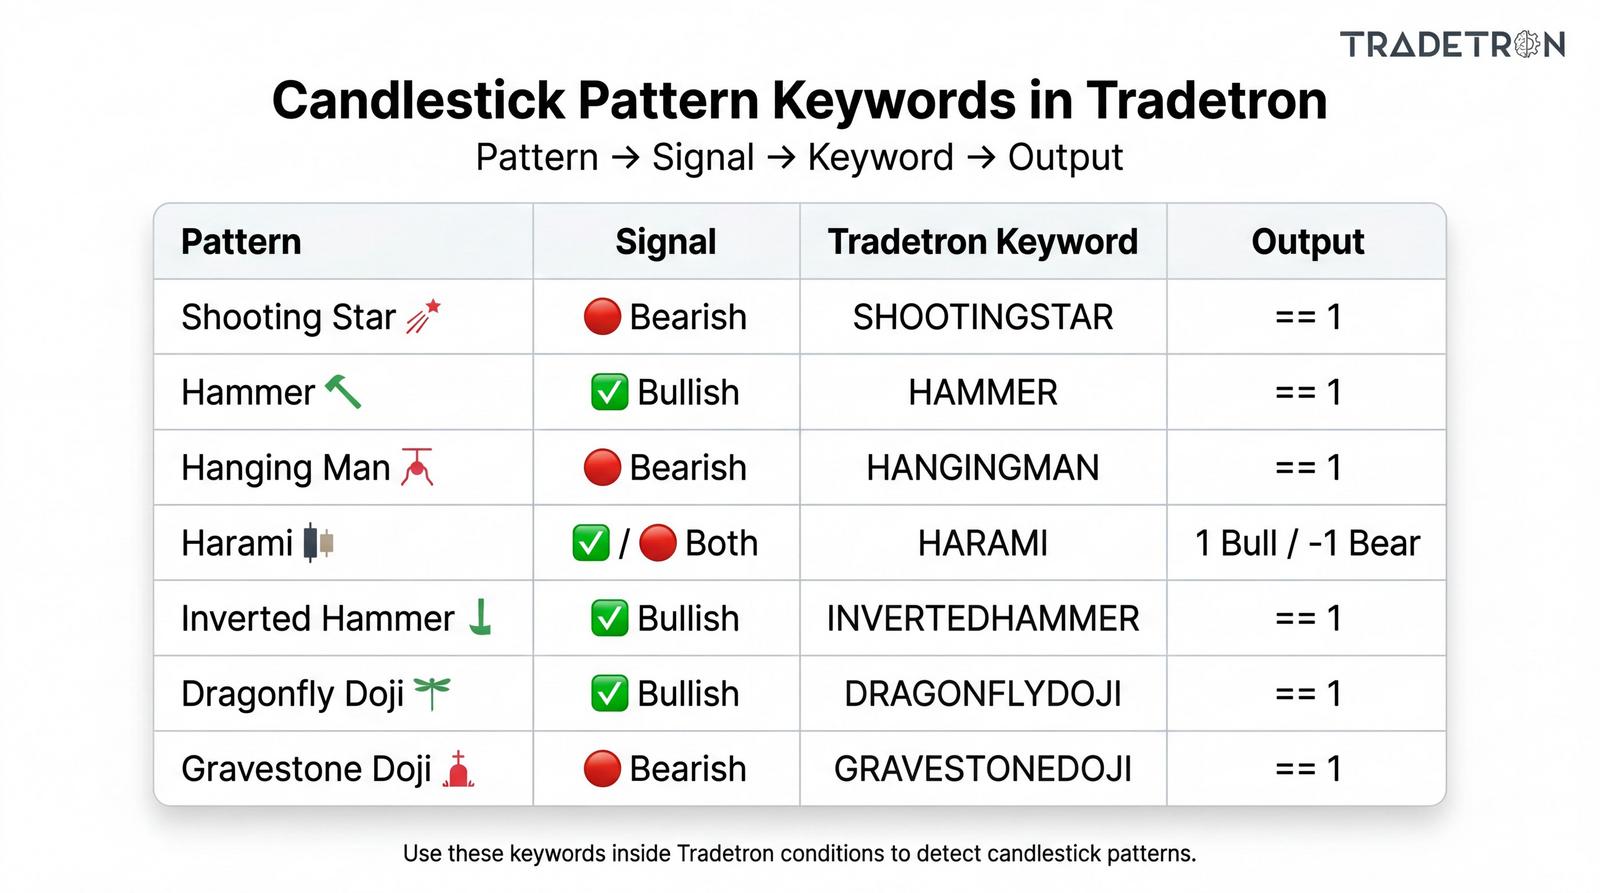
Candlestick patterns show how buyers and sellers behaved over a few candles. This guide covers 7 common patterns: what they look like, what they suggest, and the Tradetron keyword that detects each one automatically.
How the keywords work in Tradetron
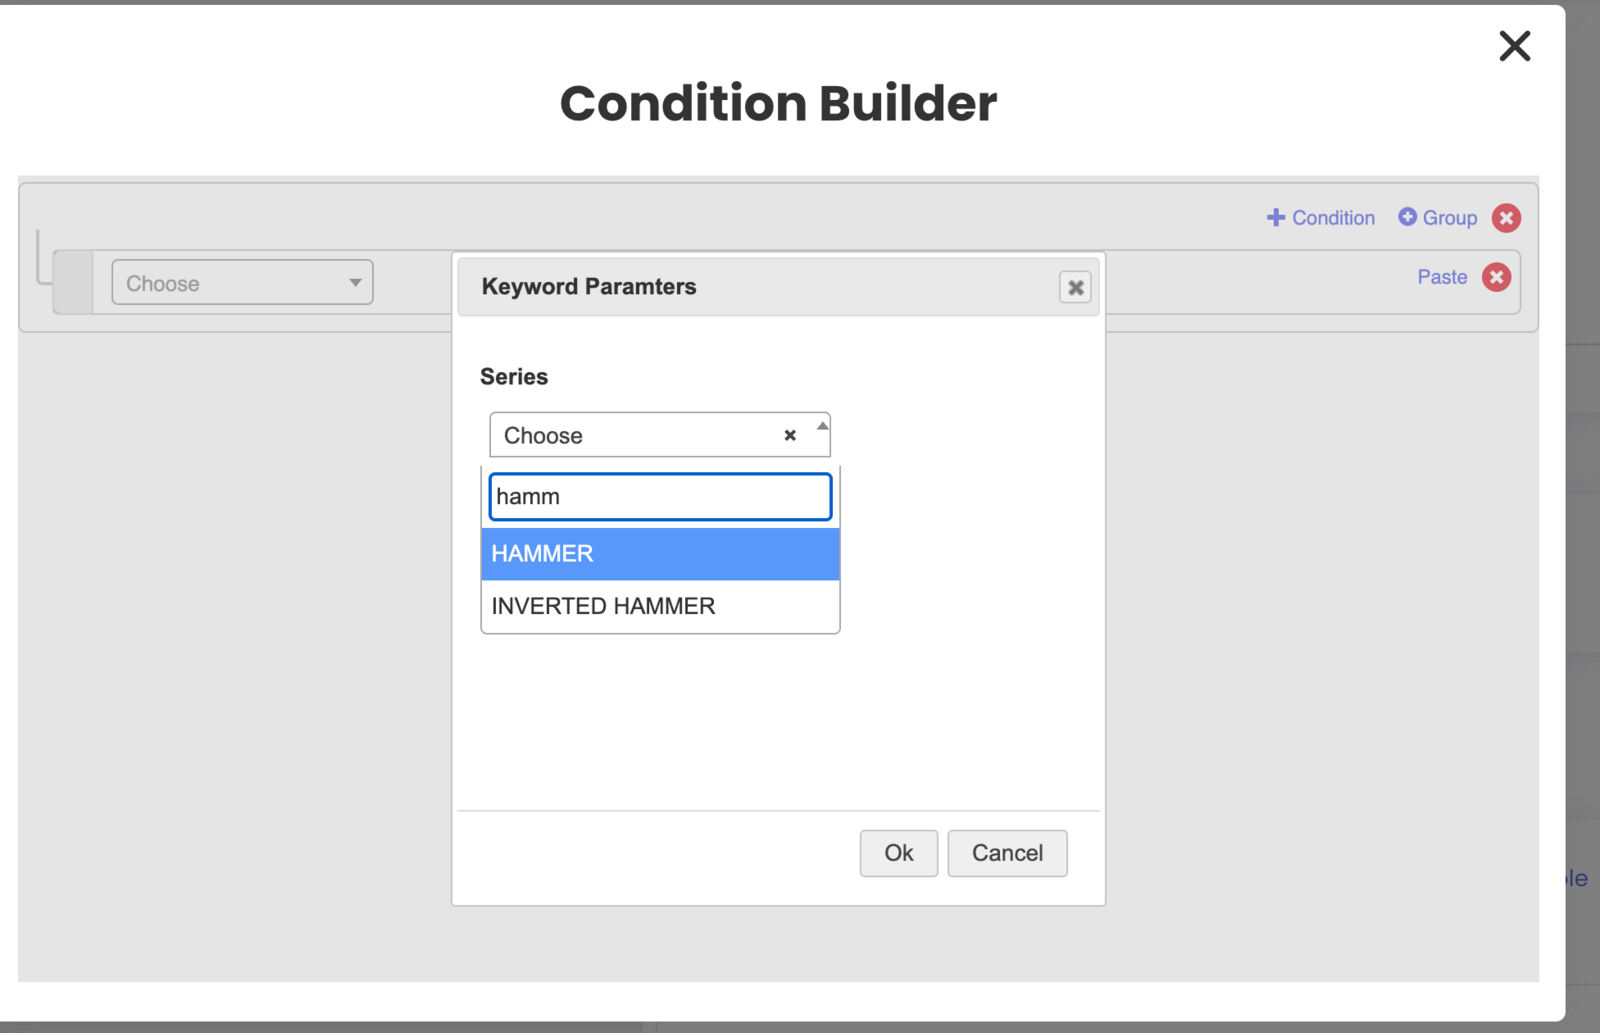
Each pattern has a built-in keyword under the Position function in the strategy builder. You pick the keyword, set the instrument and timeframe, and compare the output. No manual open/close coding is needed.
- Output == 1: pattern found (bullish for most patterns)
- Output == -1: bearish version, where one exists
- Candle offset -1 checks the last completed candle, never one still forming
Example: HAMMER ( Symbol ( Instrument Name ( NFO, NIFTY 50,,,, ) , 5m, All ) ) , -1
1. Shooting Star (bearish)
- Small body at the bottom, long upper wick (about twice the body or more), little or no lower wick.
- Appears after an uptrend.
- Buyers pushed price up, sellers pushed it back down. Strongest near resistance.

Keyword: SHOOTINGSTAR. Output == 1 = detected.
2. Hammer (bullish)
- Small body at the top, long lower wick, little or no upper wick.
- Appears after a downtrend.
- Sellers pushed price down, buyers defended the level. Strongest near support.

Keyword: HAMMER. Output == 1 = detected.
3. Hanging Man (bearish warning)
- Same shape as the Hammer, but it appears after an uptrend.
- Shows sellers starting to test the rally. Wait for a red confirmation candle.

Keyword: HANGINGMAN. Output == 1 = detected.
4. Harami (bullish or bearish)
- Two candles: a large candle, then a small candle whose body sits inside the first one.
- Bullish Harami: after a downtrend, large red then small green.
- Bearish Harami: after an uptrend, large green then small red.
- Shows momentum stalling. Look for a confirmation candle.

Keyword: HARAMI. Output == 1 = bullish, == -1 = bearish.
5. Inverted Hammer (bullish, needs confirmation)
- Same shape as the Shooting Star, but it appears after a downtrend.
- An early sign of buying interest. Wait for a green confirmation candle.

Keyword: INVERTED HAMMER. Output == 1 = detected.
6. Dragonfly Doji (bullish)
- Open and close at the top, long lower wick, almost no upper wick (looks like a T).
- After a downtrend it shows buyers absorbed the selling. A stop is usually placed below the wick.

Keyword: DRAGONFLY DOJI. Output == 1 = detected.
7. Gravestone Doji (bearish)
- Open and close at the bottom, long upper wick (an upside-down T).
- After an uptrend it shows sellers rejected the rally. A stop is usually placed above the wick.

Keyword: GRAVESTONE DOJI. Output == 1 = detected.
Quick reference
| Pattern | Signal | Appears after | Keyword | Output |
|---|---|---|---|---|
| Shooting Star | Bearish | Uptrend | SHOOTINGSTAR | == 1 |
| Hammer | Bullish | Downtrend | HAMMER | == 1 |
| Hanging Man | Bearish | Uptrend | HANGINGMAN | == 1 |
| Harami | Both | Either | HARAMI | 1 bull / -1 bear |
| Inverted Hammer | Bullish | Downtrend | INVERTED HAMMER | == 1 |
| Dragonfly Doji | Bullish | Downtrend | DRAGONFLY DOJI | == 1 |
| Gravestone Doji | Bearish | Uptrend | GRAVESTONE DOJI | == 1 |
Other pattern keywords include ENGULFING, MORNINGSTAR, MORNINGDOJISTAR, EVENINGSTAR, DOJI and MARUBOZU. Look them up in the keyword documentation.
Rules that apply to every pattern
- Location matters. A pattern at support or resistance means more than one in the middle of a range.
- Wait for the candle to close. Use offset -1.
- Confirmation helps, especially for Hanging Man, Harami and Inverted Hammer.
- Context matters. Look at the bigger trend.
- No pattern works every time. Always use a stop loss, and test in Live Offline before going live.
For education only. This is not investment advice.
 Edited with AI from the original Tradetron article, checked against current docs (Oct 2026). Spot something wrong? Tell us in the Community.