Best Indicators for Options Trading
Options trading is a sophisticated form of investing that requires the right tools and strategies to maximize profits while minimizing risks. One of the most effective ways to enhance trading accuracy is by using technical indicators. This article will explore the best indicators for options trading and the most suitable charts for making informed decisions.
Best Indicators for Options Trading
Technical indicators help traders analyze market trends, volatility, and momentum to make well-informed trading decisions. Below are some of the best indicators for options trading:
1. Implied Volatility (IV)
Implied Volatility measures market expectations of future price movements. High IV suggests higher premiums and greater uncertainty, while low IV indicates stability. Traders use IV to determine the best time to enter or exit a trade.
In Tradetron User can check Iv of their traded instruments.
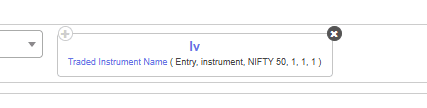
This will will help user to check the iv of set no1 entry leg iv .
2. Relative Strength Index (RSI)
The RSI helps identify overbought and oversold conditions in an asset. When RSI is above 70, the asset may be overbought, signaling a potential downturn. When it’s below 30, the asset may be oversold, indicating a possible price increase.
Below screenshots referring Rsi 14 above 70 in daily time frame.
Below screenshot refer RSi 14 below 30 in daily time frame

3. Moving Averages (MA & EMA)
Simple Moving Averages (SMA) and Exponential Moving Averages (EMA) help traders identify trends. The 50-day and 200-day moving averages are commonly used to determine long-term trends, while shorter timeframes like 9-day EMA help in short-term trading.
Below examples refer the nifty above 200 day moving average in daily time frame. That’s refer a bullish trend.
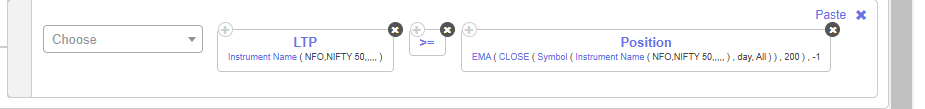
Below examples refer the nifty below 200 day moving average in daily time frame. That’s refer a Berish trends.

Users can create a ema crossover strategy
demo video how to create it.
4. Bollinger Bands
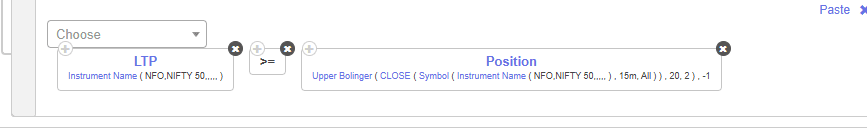
Bollinger Bands measure market volatility. When prices touch the upper band, the asset is considered overbought, and when they touch the lower band, it is considered oversold. Traders use Bollinger Bands to assess entry and exit points.
Bollinger Bands are envelopes plotted at a standard deviation level above and below a simple moving average of the price.
Examples – Below examples will be true when Ltp above upper Bollinger band.
Image
Below examples will be true when Ltp below lower Bolinger bands .
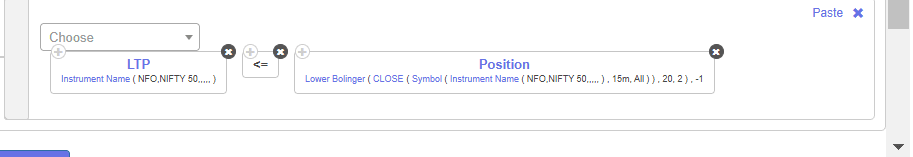
Bolinger bands guide with demo strategy
5. MACD (Moving Average Convergence Divergence)
The MACD indicator helps traders identify trend direction and momentum. A bullish crossover (MACD line crossing above the signal line) suggests an upward trend, while a bearish crossover indicates a potential decline.
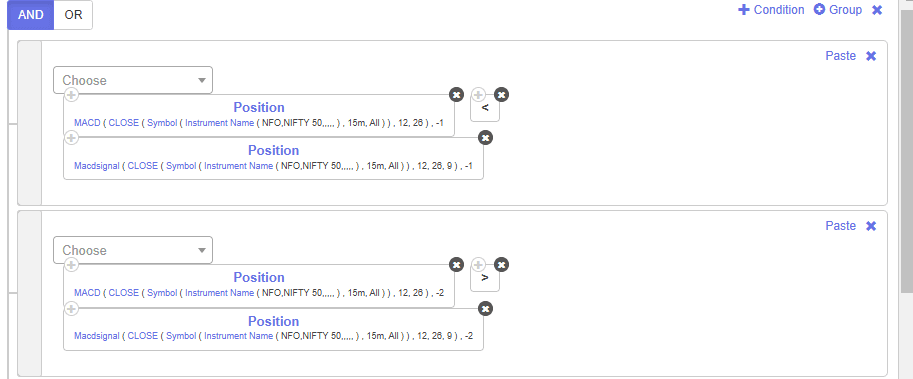
Bullish crossover- Below screenshots will check Macd bullish crossover
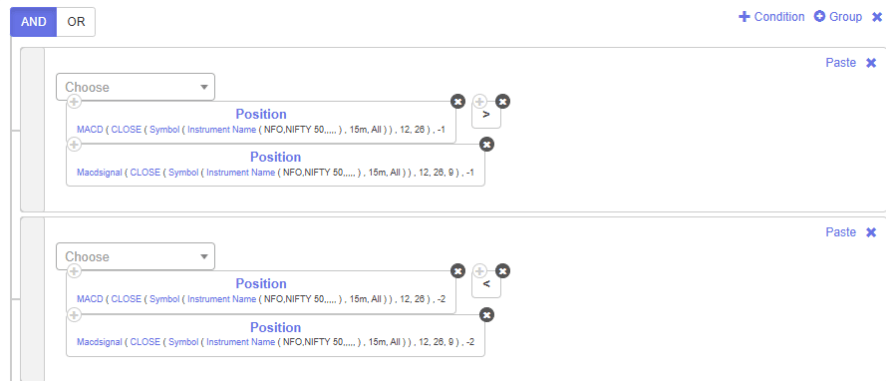
Bearish crossover-
6. Open Interest (OI) and Volume
Open Interest and trading volume provide insights into market liquidity and trend strength. Higher open interest indicates strong market participation, which can confirm trend movements.
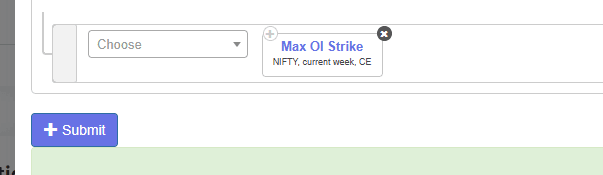
Intradetron user can select
Max oi strike - This keyword will return a numerical value of the strike of the instrument with the maximum open interest at that instant. You can input the underlying instrument, expiry and option type. Your request will be processed, and a numeric response will be fetched. At the moment it is only available for indices. This keyword can also be used in the strike fx of the position builder.
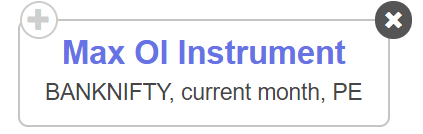
Max oi instruments - This keyword will return the instrument with the maximum open interest at that instant. You can input the underlying instrument, expiry and option type. Your request will be processed and a response will be fetched. At the moment it is only available for indices.
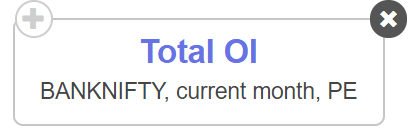
- Total Oi- It will returns the total oi for selected index.
Below above image shows how to fetch the Total OI for Nifty bank, current month put options.
7. PCR (Put call ration)-
In options trading, PCR (Put-Call Ratio) is a popular sentiment indicator that helps traders assess market sentiment based on the volume or open interest of put and call options.
In tradetron you can use Pcr –
At the moment it is only available for indices In tradetron
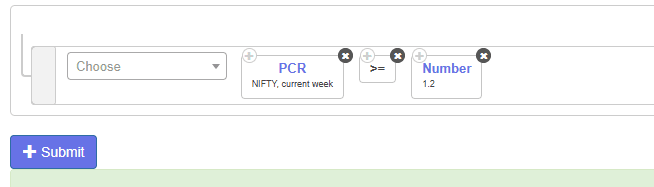
The above image shows how to build a condition to check the PCR Nifty 50, current week options and take a trade if the same is greater than or equal to 1.2.
For Options Trading, Which Chart is Best?
Choosing the right chart is crucial for options traders, as it helps in identifying price movements and trends. Below are the best chart types for options trading:
1. Candlestick Charts
Candlestick charts are the most widely used for options trading because they provide detailed price information, including open, close, high, and low prices. They also help traders spot patterns like Doji, Hammer, and Engulfing Candles, which signal potential reversals or continuations.
2. Renko Charts
Renko charts filter out minor price fluctuations and focus on trends, making them ideal for traders looking for clear trend signals without noise.
3.. Heikin ashi chart
Heikin-Ashi (HA) is a modified candlestick chart that smooths out price action to identify trends more clearly. Unlike traditional candlesticks, which use actual open, high, low, and close prices, Heikin-Ashi uses a calculated formula to filter out noise and highlight trends.
Why Technical Indicators and Charts Matter in Options Trading?
Improved Decision-Making – Indicators and charts provide valuable insights that help traders make informed decisions.
Risk Management – Understanding volatility and trends helps traders manage risks more effectively.
Enhanced Trading Strategies – Using multiple indicators together enhances accuracy and strategy execution.
Market Timing – Technical analysis helps traders determine the best time to enter or exit a trade.
Conclusion
Using the right indicators and charts is crucial for successful options trading. Traders should combine multiple indicators, such as RSI,MACD,Bollinger Bands, and Open Interest, to get a clearer picture of market trends. Additionally, choosing the best chart type, such as candlestick charts, enhances decision-making. Tradetron Platform can help automate and optimize your trading strategies using these technical indicators. Start leveraging technical analysis today to enhance your options trading success!
FAQs on Indicators and Charts for Options Trading
1. What is the best indicator for options trading?
There is no single best indicator; a combination of RSI, MACD, Bollinger Bands, and Implied Volatility provides a well-rounded strategy.
2. Can I use moving averages for options trading?
Yes, moving averages help traders identify trends and determine entry and exit points.
3. Which chart type is best for intraday options trading?
Candlestick charts are the best for intraday trading as they provide detailed price action insights.
4. How do Bollinger Bands help in options trading?
Bollinger Bands indicate market volatility and overbought/oversold conditions, helping traders find potential trade opportunities.
5. What is the role of Open Interest in options trading?
Open Interest helps gauge market participation and liquidity, making it useful for confirming trend strength.