Backtesting Option Selling Strategies Across Lot Size Changes
When you backtest an intraday option-selling strategy over several years, "1 lot" doesn't mean the same quantity throughout: exchanges revise lot sizes, and a backtest that uses the lot size in force on each date trades more units in some periods than others. To compare periods fairly, normalise every day's P&L to the same number of units, for example the least common multiple (LCM) of the lot sizes involved.
Why lot sizes distort a long backtest
Suppose you backtest an intraday NIFTY option-selling strategy with a quantity of 1 lot over three years. If the lot size was larger in the first part of that window and smaller in the second, the strategy sold more units early on. Every point it earned or lost was worth more.
The result is a P&L curve with a hidden kink: the slope changes at the revision date, and it has nothing to do with whether the strategy got better or worse. Drawdowns, average daily P&L and win/loss sizes from the two periods can't be compared directly.
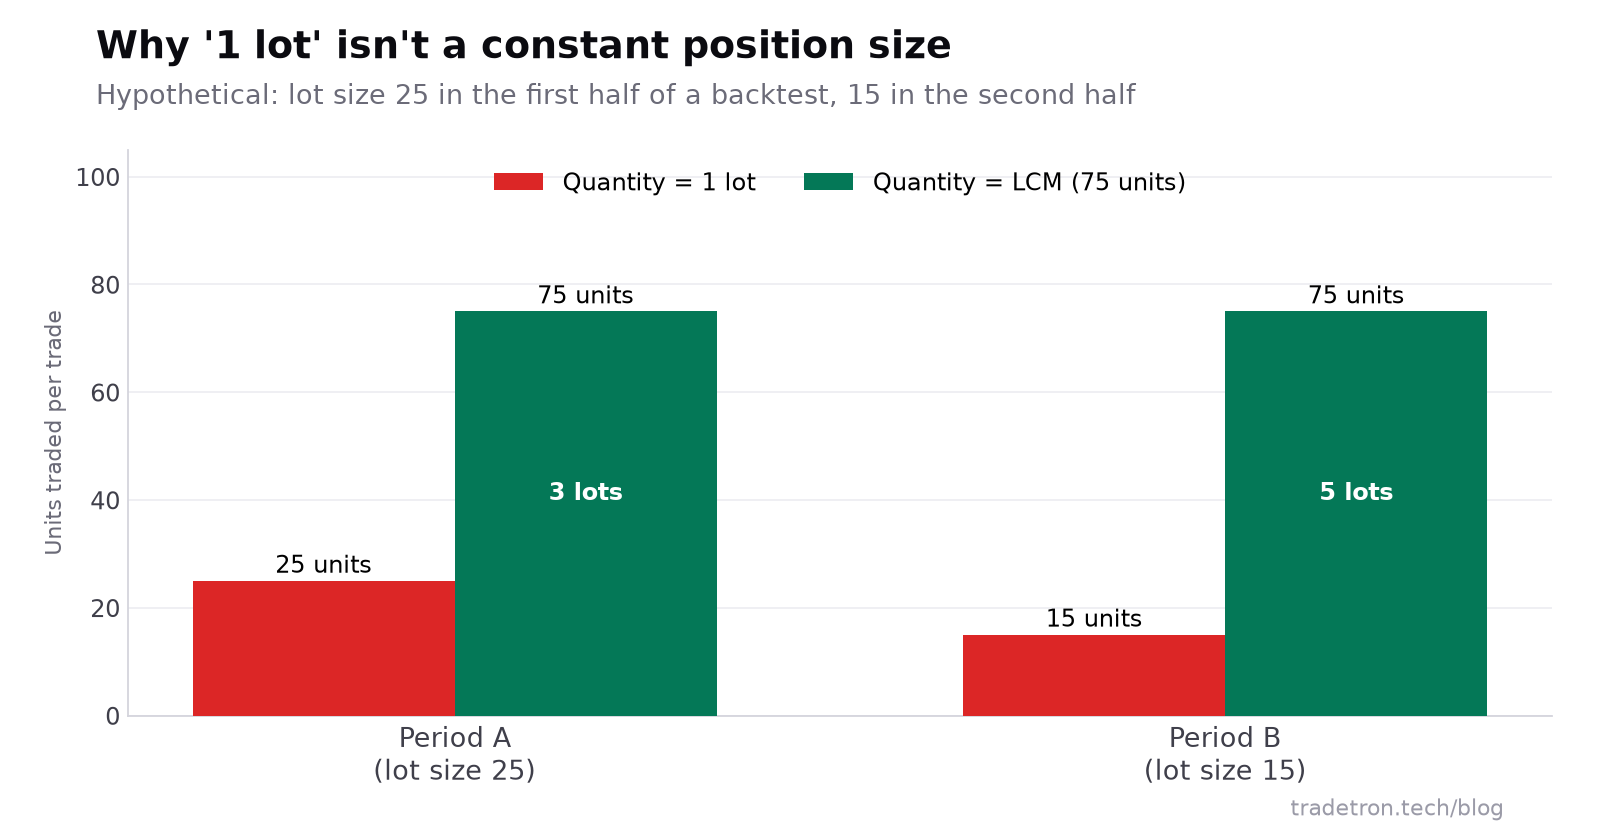 Hypothetical lot sizes of 25 and 15: normalising to 75 units makes both periods trade the same quantity
- 25 lot size in period A (hypothetical)
- 15 lot size in period B (hypothetical)
- 75 units: the LCM, = 3 lots of 25 or 5 lots of 15
How to normalise the P&L
- Run the backtest for the full period with a fixed quantity in lots, and download the day-wise P&L from the backtest report.
- Mark the lot size that applied on each date. Exchange circulars list every revision and its effective date.
- Pick a common quantity. The LCM of the lot sizes is the smallest number of units that is a whole number of lots in every period. For 25 and 15, it is 75.
- Scale each day. Multiply each day's P&L by common quantity ÷ (that day's lot size × lots traded). With 1 lot: × 3 in the lot-25 period, × 5 in the lot-15 period.
- Rebuild the curve from the scaled daily P&L and recompute drawdown, average win and average loss.
If you'd rather not work in a spreadsheet, divide each day's P&L by the units traded that day. P&L per unit (in points) is directly comparable across any lot-size change, and you can multiply back to your intended position size at the end.
Why this matters for option sellers in particular
Intraday option-selling strategies earn small amounts on most days and occasionally take a large loss. Two numbers decide whether they are worth running: the ratio of average win to average loss, and the size of the worst drawdown. Both are easy to distort:
- If the larger lot size happened to coincide with a calm period, the strategy's wins look bigger than they really were.
- If a big loss fell in the large-lot period, the worst drawdown is overstated relative to today's position size.
- Capital required and return on capital also change with lot size, because margin is per lot.
So before you size a strategy for live trading from an old backtest, translate the history into today's quantity.
Sizing for today's lot sizes
NIFTY's lot size is 65 and BANK NIFTY's is 30 for 2026. If your strategy was built and backtested when lots were different:
- Re-check the quantity in every position. A strategy that says "1 lot" now trades a different number of units than when you tested it.
- Re-check capital. Margin per lot moves with the lot size.
- Re-check fixed-rupee rules. A stop loss or target written in rupees per lot behaves differently when a lot has more or fewer units. Rules written in points or percentages don't have this problem.
Our post on what to check now that NIFTY's lot is 65 and BANK NIFTY's is 30 has a full checklist.
Pros of normalising
- Periods before and after a revision become comparable
- Drawdowns and averages reflect one consistent position size
- Easy to scale the result to today's quantity
Cons and limits
- Needs the day-wise P&L and the revision dates
- Doesn't fix other changes, like expiry days or margin rules
- Scaling assumes fills would have been the same at the larger size
For more on reading a backtest, see understanding back test report settings and why backtests don't match live trading.
Frequently asked questions
Why do lot sizes affect backtest results?
A backtest that trades "1 lot" trades more units when the lot size is bigger. Periods with a larger lot size show bigger rupee profits and losses for the same price moves, which distorts averages, drawdowns and the shape of the P&L curve.
How do I adjust a backtest for lot size changes?
Download the day-wise P&L, then scale each day to a common number of units. The least common multiple of the lot sizes works well because it is a whole number of lots in every period. Alternatively, convert every day's P&L to points per unit.
What is the LCM of two lot sizes?
It is the smallest number divisible by both. For lot sizes of 25 and 15, the LCM is 75: 3 lots of 25 or 5 lots of 15.
What is the current NIFTY lot size?
NIFTY's lot size is 65 and BANK NIFTY's is 30 for 2026. Check NSE's latest circular before trading, because lot sizes are revised from time to time.
Do I need to change my strategy after a lot size revision?
Check it. The number of lots, the capital required and any rupee-based stop or target may all need updating. Rules written in points or percentages carry over unchanged.