All About Backtests in Tradetron: A Detailed Guide
A backtest runs your trading strategy's exact rules on past market data to show how they would have behaved: every entry, exit and stop, day by day. On Tradetron you can backtest any strategy you build, without code, and get a report with P&L, drawdown and the full list of trades before you risk real money.
The settings that make a Tradetron backtest honest, and how to read the result, in 3 minutes. हिन्दी में देखें: Tradetron पर backtesting: वो settings जो इसे ईमानदार बनाती हैं, 3 मिनट में
What is backtesting?
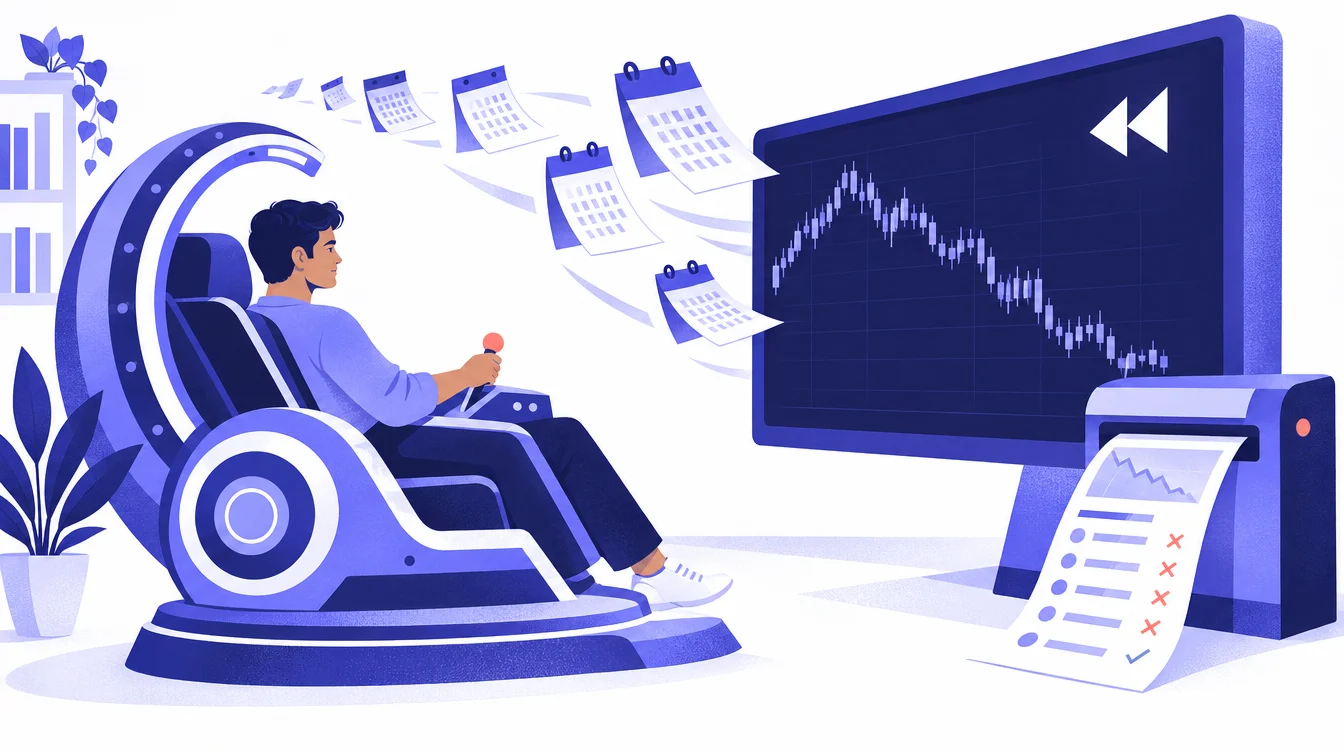
Backtesting is testing a trading idea on historical data. You write the rules ("sell a NIFTY straddle at 9:20, exit at 3:15 or if the combined premium rises 25%"), and the backtest engine replays the market minute by minute, applying those rules as if you had traded them.
It answers questions you can't answer by looking at a chart:
- How often did the rules actually trigger?
- What was the worst losing streak, and how deep did the account fall from its peak?
- Did the profit come from a few lucky days or from steady results?
- Does a stop or a target that sounds sensible actually help?
Backtest results and live results will differ. Live trades pay slippage and charges, fills aren't always at the price you expect, and the market changes. We go through the gaps in nine reasons your backtest doesn't match live trading.
How to run a backtest on Tradetron
 The Backtest page: every run with its grade, return, drawdown and Sharpe
- Build or open a strategy in the strategy builder (or pick a template you've copied).
- Click Backtest on the strategy. The backtest form opens.
- Fill in the settings described below: date range, candle frequency, trade price, type and expiry.
- Submit. Tradetron checks the strategy first and tells you if something in it can't be backtested, or if your date range starts before the data does.
- Wait for the report. Time depends on the date range, the candle frequency and how complex the strategy is. You get a link to the report when it's ready, and it stays on your Backtest page.
The backtest settings, explained
| Setting | What it means | How to choose |
|---|---|---|
| Date range | The period of history to test | Long enough to include different markets: trending, sideways and volatile |
| Candle frequency | How often the engine checks your conditions (1 minute up to 1 day) | Use the smallest timeframe your strategy uses. Use 1 minute if you use time conditions or LTP |
| Trade price | Which price of the candle trades are filled at: Open or Close | Open for indicator and crossover signals; Close for price action or LTP-based rules |
| Type | Intraday or Positional | Intraday if every position is closed the same day; positional if anything is carried overnight |
| Expiry (positional) | None, Weekly or Monthly | None for stocks; Weekly or Monthly to match the options or futures you trade |
Date range
Longer is usually better, as long as the rules make sense across the whole period. A strategy tested only in a calm, rising year has never met a crash. Index F&O data goes back to 2020; some instruments start later (for example, single-stock option data begins in mid-2024), and the form will tell you if your range starts too early.
Candle frequency
The engine checks your conditions once per candle. A strategy that uses 15-minute and 1-hour indicators needs a frequency of 15 minutes or less. A strategy with a 9:20 entry or an LTP-based stop needs 1 minute, or the checks will land at the wrong times.
Smaller candles mean more checks, so the run takes longer. That is the price of accuracy, and on most strategies it is worth paying.
Trade price: Open or Close
This is the price at which the backtest fills your trades within each candle. If your rule fires on a crossover or indicator signal, Open is the closer match to what happens live, because in reality you can only act after the signal appears. If your rules act on price action or LTP, choose Close. Backtest settings explained has a table of examples.
Type: intraday or positional
Testing several values at once: sweeps
Not sure whether your stop loss should be 20%, 25% or 30%? The backtest form's sweep option runs the same strategy over several values of one number in it, and shows the results side by side.
Two cautions:
- Pick the setting for the right reason. The best-looking value on past data is often the one that fitted past noise best. Prefer a value whose neighbours also did reasonably well.
- Use the hold-back. A sweep can keep part of the period aside (walk-forward testing): values are compared on the first part, then checked on data they haven't seen. A setting that falls apart on the held-back data was probably overfitted.
Our guide to optimising a trading algorithm covers overfitting in more depth.
How to read the backtest report
The report opens as a page you can come back to from your Backtest page, and you can download the trades for your own analysis. These are the numbers to look at first:
| Metric | What it tells you |
|---|---|
| P&L curve | How profit and loss built up over time. Smooth and rising beats spiky |
| Total P&L and ROI | The overall result, and as a percentage of capital |
| Drawdown | The biggest fall from a peak to a low. The number to compare with what you can stomach |
| Win days / loss days | How many days made or lost money |
| Average profit on profit days vs average loss on loss days | Whether your wins are big enough to pay for your losses |
| Max profit and max loss in a day | Your best and worst single days |
| Sharpe ratio | Return per unit of volatility; higher is better |
| Month-wise P&L | Whether results are spread across months or come from a few |
| Trades / positions | Every entry and exit with time, price and quantity |
For a full walk through every metric, read how to evaluate the performance of an algo strategy and the Sharpe ratio explained.
Costs: brokerage and slippage
Brokerage and slippage are applied after the run, in the report's cost section, so you can try different assumptions without running the backtest again. Always look at the result after costs. A strategy that trades many times a day can turn from profit to loss once realistic slippage is added. Read more in understanding slippage.
What a backtest can't see
The engine simulates the market, and a few things don't carry over exactly:
- Moves inside a candle. Conditions are checked on candle data, so a quick spike that reverses within the minute can be missed in the test even though live trading would see it.
- Real fills. Live orders meet the order book, partial fills and fast markets.
- Execution settings. Advanced order handling you set for live trading (price revisions, tranching) isn't the same thing as a backtest fill.
- Anything that depends on real clock seconds. A backtest's time comes from its candles, so a condition on the current second has nothing to read.
When you submit, Tradetron's check flags keywords or instruments that can't be backtested, so you find out before the run, not after.
Checklist before you backtest
- Test the logic first. Run the strategy Live Offline for a few days, where it runs and records every trade but nothing is sent to the exchange, to confirm entries and exits happen when you expect.
- Check your exits. Every set needs a way out: an exit condition, a stop, or a universal exit.
- Match the type and expiry to how the strategy really trades.
- Choose the right candle frequency for the smallest timeframe and any time-based rules.
- Don't edit the strategy while a backtest is running. Make a copy if you want to try changes.
- Read the result after costs before you draw any conclusion.
How to find your Backtest ID
Each run has a Backtest ID (BID). You'll find it against the run on your Backtest page. Quote it when you contact support about a specific run.
Backtest credits
Backtests use credits. The backtest form shows what a run will use before you submit, and if a run can't produce a valid result, the credit is refunded automatically.
Frequently asked questions
What is a backtest in trading?
A backtest is a simulation that applies a strategy's rules to historical market data to see how it would have performed: when it would have entered and exited, how much it would have made or lost, and how deep its worst losing period was.
How do I backtest a strategy on Tradetron?
Open the strategy, click Backtest, choose the date range, candle frequency, trade price, type (intraday or positional) and expiry, and submit. When the run finishes you get a link to the report, which also stays on your Backtest page.
Which candle frequency should I choose?
Choose a frequency equal to or smaller than the smallest timeframe your strategy uses. If the strategy has time-based entries or exits, or uses LTP, choose 1 minute.
Should I choose Open or Close as the trade price?
Choose Open if your trades are triggered by signals such as crossovers or indicators, since live trades can only happen after the signal. Choose Close if your rules act on price action or LTP.
Why don't my backtest results match live trading?
Live trading pays slippage and charges, fills don't always happen at the candle price, quick moves inside a minute are visible live but not always in the test, and markets change. Apply realistic costs in the report and run the strategy Live Offline before trading real money.
How much backtesting is enough?
Enough to cover different market conditions: at least one sharp fall, a sideways stretch and a trending period. For intraday strategies that usually means a couple of years of data. More important than length is that the result holds up across sub-periods and nearby settings.
Does a good backtest mean the strategy will make money?
No. A backtest shows how rules behaved on past data. It is a filter for bad ideas, not a forecast. Test the strategy Live Offline and start small when you go live.