₹150 premium strangle strategy with re entry at cost for SL and re execution on target
Contents
Introduction:
In this blog post, we're excited to share a powerful strategy that was introduced by a friend. It's a challenging yet rewarding approach, and we believe it's worth exploring together. We'll delve into the details of this strategy, implement it on Tradetron, and analyze the backtest results to understand its efficacy.
Understanding the Strategy Logic: A Modified Strangle
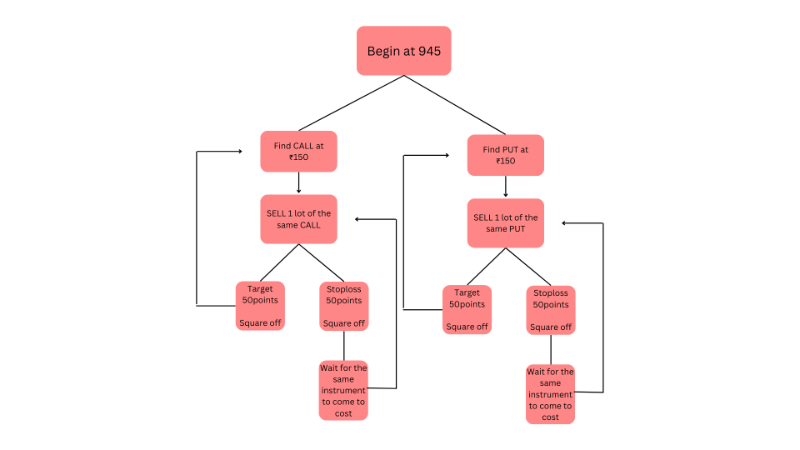
The strategy operates like a strangle, focusing on both call and put options. At precisely 9:45 AM each day, we scan for call and put options trading at 150 rupees. For simplicity, let's break down the logic for call options initially.
If an 18,000 call option is trading at 150 rupees, the strategy shorts one lot of this call. Fixed targets and stop-loss values are set at 50 points each. If the target is hit, the strategy seeks another call option trading at 150 rupees and repeats the process.
However, if the stop-loss is triggered, a unique "wait and trade" strategy is employed. The strategy waits for the same call option to revert to the entry price. Once it does, it shorts the call again, reapplying the fixed targets and stop-loss logic.
Implementation on Tradetron: Sets and Conditions
To implement this on Tradetron, four sets are created – two for calls and two for puts. Let's focus on sets one and two for calls, as sets three and four mirror their logic.
In set one, conditions ensure it's either the first trade of the day or more than 9:45 AM. For set two, it checks if it's the second trade of the day and imposes additional checks.
The strategy utilizes runtime variables, especially the "what profit" variable, which distinguishes between profits and losses. This variable guides the flow of the strategy – whether to find a new strike for profits or initiate the wait and trade strategy for losses.
Moreover, runtime variables are created upon entry, capturing instrument name, strike, and entry price. These variables become crucial for the wait and trade logic.
Backtesting Insights: Unveiling Performance Metrics
After running a backtest for the past 30 months, the results are promising. The equity curve demonstrates consistent growth with limited drawdowns, peaking at around 8-9%. Notably, Wednesdays and Thursdays stand out as the highest performing days, aligning with high-trending market conditions.
Statistical data, including return histograms, daily movements, and volatility ratios, provide a comprehensive view of the strategy's performance. These metrics showcase the strategy's ability to capitalize on trending setups, offering potential benefits for traders.
Conclusion: Embracing Continuous Improvement
In the dynamic world of trading, strategies require continuous refinement. This approach exemplifies the iterative process of strategy building. By adapting and optimizing based on historical data, traders can enhance the efficiency of their trading systems.
As always, the strategy link is provided in the description. Feel free to duplicate, paper trade, backtest, and explore its potential. If you have other strategies you'd like us to cover in future blogs, drop your suggestions in the comments or reach out to us at https://tradetron.tech/pages/contact
Duplicate link: https://tradetron.tech/strategy/3967552