


Tradetron for Mobile
This keyword returns the positive value of the inputs.

The above condition will return the absolute (positive) value of the math operation, even if LTP is smaller than the entry price, it will still return a positive number
This keyword is used to add a value to the entire series /array of the selected instrument. This keyword is used under the position keyword

The above example will add 10 to all the close values of the NIFTY 50 series
This keyword can be used under other indicators too, check the example below

This keyword returns the Average Directional Index (ADX) indicator value of the selected Instrument for the selected timeframe. This keyword is to be used under the position keyword.

The above keyword will return the previous day ADX value of ABFRL
ADX is used to quantify trend strength. ADX calculations are based on a moving average of price range expansion over a given period of time
Read more about ADX here - https://www.investopedia.com/articles/trading/07/adx-trend-indicator.asp
This keyword returns the value of the smooth Average Directional Index of the selected Instrument. This keyword is to be used under the position keyword

You can fetch the smooth Average Directional Index on any candle of an instrument, like in the above example, you can fetch the smooth Average Directional Index of previous (-1) day candle of Nifty 50 spot
This keyword gives the Alligator value in series of the selected Instrument. This keyword is to be used in the Position keyword. The same indicator will take the input of several values used in the calculation on the same indicator lines. The Alligator indicator can return the value of any one of the three lines, Jaw Length, Teeth Length and Lips Length.

This keyword will fetch the 'Jaw Length' line of the Nifty 50 spot day candle.

This keyword will fetch the 'Teeth Length' line of the Nifty 50 spot day candle.

This keyword will fetch the 'Lips Length' line of the Nifty 50 spot day candle.
These keyword(s) can be used along with other keywords to create a logic based on the same indicator.
This keyword returns the Arnaud Legoux moving average (ALMA) indicator of the selected Instrument for the selected timeframe.This keyword is to be used under the position keyword

it has 3 input parameters which are :

ALMA is used to eliminate minor price fluctuations and enhance the trend of the market. It lessens the noise through zero-phase digital filtering and creates signals that are more reliable than the signals generated by other conventional moving averages.
This keyword returns the AROON DOWN indicator value of the selected Instrument for the selected timeframe. This keyword is to be used under the position keyword

The above keyword will return the previous day AROON DOWN value of ABFRL
The Aroon indicator is a technical indicator that is used to identify trend changes in the price of an asset, as well as the strength of that trend.
Learn more about Aroon here -https://www.investopedia.com/terms/a/aroon.asp
This keyword returns the AROON UP indicator value of the selected Instrument for the selected timeframe. This keyword is to be used under the position keyword

The above keyword will return the previous day AROON UP value of ABFRL
The Aroon indicator is a technical indicator that is used to identify trend changes in the price of an asset, as well as the strength of that trend.
Learn more about Aroon here -https://www.investopedia.com/terms/a/aroon.asp
It returns the Best Ask Price of the selected Instrument
Note- Ask price is returned only if it is changed from last tick, else returns LTP only
ATM keyword returns the ATM strike of the instrument. Please note that, ATM keyword returns the ATM strike based on the Futures chart
ATM keyword is generally used in Strike FX in Position Builder
 In the above image, Suppose Nifty futures is 17480, ATM strike will return 17500.

In the above image, +2 indicates 2 strikes away from ATM, suppose ATM is 17500, ATM,+2 will return 17600

This keyword can also be used in the Instrument Name keyword to fetch an instrument based on the futures-based ATM value of the same
ATM spot keyword returns the ATM strike of the instrument based on the spot value of the instrument.
ATM keyword is generally used in Strike FX in Position Builder
 In the above image, Suppose Nifty spot is 17480, ATM strike will return 17500.

In the above image, +2 indicates 2 strikes away from ATM, suppose ATM is 17500, ATM,+2 will return 17600

This keyword can also be used in the Instrument Name keyword to fetch an instrument based on the spot-based ATM value of the same
This keyword will return the Implied Volatility of the ATM option for the selected underlying instrument.
Pls note - ATM is selected based on futures chart and not Spot chart

This keyword gives the ATR value in series of the selected Instrument. This keyword is to be used in the Position keyword

The above condition will output the ATR period 14 of NIFTY 50 futures in 15min timeframe
Average true range (ATR) is a volatility indicator that shows how much an asset moves, on average, during a given time frame.
Read more about ATR here -https://www.investopedia.com/articles/technical/02/092402.asp
This keyword returns the value of the Awesome Oscillator of the selected Instrument. This keyword is to be used under the position keyword

You can fetch the value of the Awesome Oscillator on any candle of an instrument, like in the above example, you can fetch the Choppiness Index of previous (-1) day candle of Nifty 50 spot
This keyword will return the previous day's Balance of Power which compares the power of buyers to push prices to higher extremes with the power of sellers to move prices to lower extremes. When the indicator is in positive territory, the bulls are in charge; and sellers dominate when the indicator is negative.

The above keyword will return the previous day Balance of Power value for NIFTY 50
Read more about Balance of Power - https://school.stockcharts.com/doku.php?id=technical_indicators:balance_of_power
Bollinger Band Percent (BB %B) quantifies a symbol's price relative to the upper and lower Bollinger Band.

it has 2 input parameters :

It returns the difference between the Best Bid and the best Ask Price of the selected Instrument
Note - Bid/Ask Difference is returned only if there is a change in the bid and the ask in the last tick, else returns 0.
It returns the Best Bid Price of the selected Instrument
Note - Bid price is returned only if it is changed from last tick, else it returns LTP only
This keyword returns the width of the Bollinger band of any period of any series of the selected Instrument. This keyword is to be used under the position keyword

You can fetch the Bollinger Band width on any series, like close in the above example, you can also plot the same on RSI, OPEN etc
This keyword returns the Commodity Channel Index (CCI) indicator value of the selected Instrument for the selected timeframe. This keyword is to be used under the position keyword

The above keyword will return the previous day CCI value of ABFRL
The CCI is a market indicator used to track market movements that may indicate buying or selling
Read more about CCI here -https://www.investopedia.com/articles/active-trading/031914/how-traders-can-utilize-cci-commodity-channel-index-trade-stock-trends.asp
This keyword returns the Central Pivot Range (CPR) value of the selected Instrument. This keyword is to be used under the position keyword. CPR works on DAILY timeframe by default
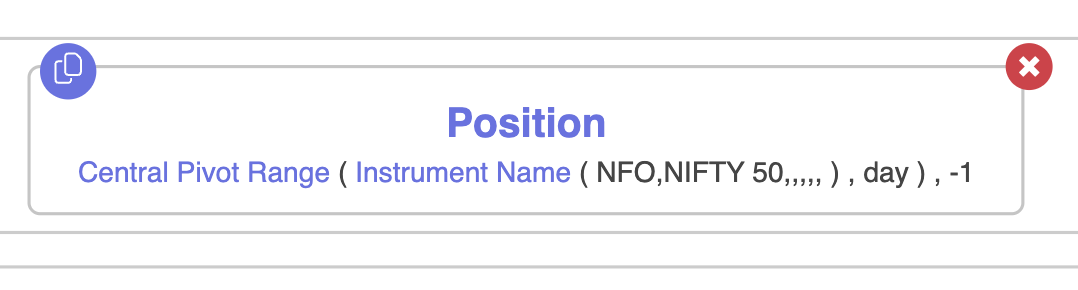
Components:
The above keyword will return the previous day CPR value of NIFTY 50
Central Pivot Range (CPR) versatile technical indicator usually comprising of only 3 levels: A central pivot point (pivot), A top central level (TC), and A bottom central level (BC).
Read more about Central Pivot Range (CPR) - https://zerodha.com/varsity/chapter/the-central-pivot-range/
This keyword returns the Chaikin Money Flow of any period of the selected Instrument. This keyword is to be used under the position keyword.

The above keyword will return the Chaikin Money Flow of Nifty 50 spot on 5 mins candle with 15 period.
This keyword returns the Chandelier Exit value of the instrument selected. You can fetch this keyword by searching for it within the position keyword.

On selecting Chandelier Exit you can input if you need the log exit or short exit along with your inputs for period and multiplier.
 The final condition should look like this:

The above condition will check if the Chandelier Exit is greater than the close of Nifty 50 on a 5 min candle.
Change returns the change in the price of the instrument as compared to the Previous Day Close.

This keyword gives you the difference between the Last Traded Price of an instrument and the previous day's close price of that instrument in percentage.

Here, 2 implies 2%, -2 implies -2% and so on
Note- No need to add % sign at end of the number
This keyword returns the value of the Choppiness Index of the selected Instrument. This keyword is to be used under the position keyword

You can fetch the Choppiness Index on any candle of an instrument, like in the above example, you can fetch the Choppiness Index of previous (-1) 5 min candle of Nifty 50 spot
This keyword returns the Close value of the selected Instrument. This keyword is to be used under the position keyword

The above keyword will return the previous day Close price of ABFRL
This keyword returns the Chande momentum oscillator of any period of any series of the selected Instrument. This keyword is to be used under the position keyword

You can plot Chande momentum oscillator on any series, like close in the above example, you can also plot CMO of RSI, OPEN etc
This keyword returns a long-term price momentum indicator used primarily to recognize major downturns and upturns in a stock market index. It is also known as the "Coppock Guide."
You have to mention Wma Period as input for the keyword
This keyword will return the correlation coefficient of the two series selected. Users can input 2 series of their choice and the period i.e How many previous data to consider

The above condition will give the correlation coefficient of NIFTY 50 and HDFC based on the past 20 days of data
Cross keyword is used to find if there has been a crossover in the previous candles. Cross keyword is to be used under position keyword.
Cross takes 2 input series
If a crossover is taken place it returns True, if not, it returns False

In the above example ,we are checking if close price has given a crossover above EMA 20 in previous daily candle. If it has crossover, keyword will return true and strategy will execute
This keyword returns the current month expiry date of the instrument as a string in the format YYYY-MM-DD
This keyword can be used in condition builder as well as in expiry FX of the position builder

The above example can be used in condition builder to check if the current day is the monthly expiry

The above condition can be used in the expiry FX of the position builder to trade next month expiry
This keyword returns the current weekly expiry date of the instrument as a string in the format YYYY-MM-DD
Please make sure not to use stocks in this as they don’t have weekly expiries.
This keyword can be used in condition builder as well as expiry FX in position builder

The above example can be used in condition builder to check if current day is weekly expiry

The above condition can be used in the expiry FX of the position builder to trade next week expiry
This keyword will fetch a particular date. It can be used to build a logic where you are comparing two different dates. This keyword will return the date in YYYY-MM-DD format.

In the example shared above, we are comparing today with a specific date in future. This keyword is specially useful when you want to take positions on a specific date.
Day keyword returns the current day of the current month. Please make sure not to use 25.00 or something. It should be a positive integer only.
The below example is checking whether today is the 21st day of the month

This keyword is used to calculate the difference between days and the output is an integer
Days Difference has 2 inputs. Please note that keywords that return DD-MM-YYYY formats can only be used as inputs.
In this keyword, D1 is subtracted from D2, so always D2 should be the bigger one

In the above condition, we are checking if the difference between the Current month expiry and today is greater than 15 days.
It considers all calendar days including holidays and non-trading days. You can find more detail on this keyword in the video link shared below:
Delta keyword returns the delta value of that particular option
Usually, Delta keyword is used to get the delta values of traded instruments

The above example will return the delta value of the instrument traded in entry set 1,leg 1
This keyword returns the quantity of selected instrument required to make the net Delta of all positions in the strategy of selected underlying to zero. Returns quantity in multiples of the lot size of Instrument as float
This keyword is usually used in QTY FX in position builder

This keyword returns the Double Exponential Moving Average value of the instrument. This keyword like all technical indicators are to be used under the Position keyword

The above condition is checking if the Previous 5 minute (-1) DEMA value is greater than previous to previous 5 minute (-2) DEMA value of Nifty Bank spot.
The DEMA uses two exponential moving averages (EMAs) to eliminate lag and responds more quickly to near-term price changes than a normal exponential moving average (EMA).
Read more about Double Exponential Moving Average (DEMA) here - https://www.investopedia.com/terms/d/double-exponential-moving-average.asp
This keyword returns the value of the negative directional movement indicator line. This keyword like all technical indicators are to be used under the Position keyword

The above condition is checking if the Previous day(-1) DMI negative value is lesser than the previous to previous day value (-2) for Nifty bank spot.
The average directional index (ADX) is used to determine when the price is trending strongly. The ADX makes use of a positive (+DI) and negative (-DI) directional indicator in addition to the trendline.
Read more about ADX here -https://www.investopedia.com/articles/trading/07/adx-trend-indicator.asp
This keyword returns the value of the positive directional movement indicator line. This keyword like all technical indicators are to be used under the Position keyword

The above condition is checking if the Previous day(-1) DMI positive value is greater than the previous to previous day value (-2) for Nifty 50
The average directional index (ADX) is used to determine when the price is trending strongly. The ADX makes use of a positive (+DI) and negative (-DI) directional indicator in addition to the trendline.
Read more about ADX here -https://www.investopedia.com/articles/trading/07/adx-trend-indicator.asp
This keyword is used to divide the entire series /array of the selected instrument by a value. This keyword is used under the position keyword

The above example will divide all the close values of the NIFTY 50 series by 10
This keyword returns the Donchain Lower channel value. This keyword like all technical indicators are to be used under the Position keyword

The above condition is checking if the Previous day(-1) Donchain Lower Channel value is greater than the previous to previous day value (-2)
Donchian Channels are three lines generated by moving average calculations that comprise an indicator formed by upper and lower bands around a midrange or median band.
Read more about Donchian Channels here - https://www.investopedia.com/terms/d/donchianchannels.asp
This keyword returns the Donchain Middle channel value. This keyword like all technical indicators are to be used under the Position keyword

The above condition is checking if the Previous day(-1) Don chain Middle value is greater than the previous to previous day value (-2)
Donchian Channels are three lines generated by moving average calculations that comprise an indicator formed by upper and lower bands around a midrange or median band.
Read more about Donchian Channels here - https://www.investopedia.com/terms/d/donchianchannels.asp
This keyword returns the Donchain Upper channel value. This keyword like all technical indicators are to be used under the Position keyword

The above condition is checking if Previous day(-1) Don chain upper value is greater than the previous to previous day value (-2)
Donchian Channels are three lines generated by moving average calculations that comprise an indicator formed by upper and lower bands around a midrange or median band.
Read more about Donchian Channels here - https://www.investopedia.com/terms/d/donchianchannels.asp
This keyword returns the DonChain Width of the selected Instrument. Like all indicators, this keyword is supposed to be used under the position keyword

The above condition is checking if Donchain channel width of Nifty 50 spot is greater than 50

Donchian Channels are three lines generated by moving average calculations that comprise an indicator formed by upper and lower bands around a midrange or median band.
Read more about Donchian Channels here - https://www.investopedia.com/terms/d/donchianchannels.asp
This keyword is used to check if a particular candle was a Dragonfly Doji. It is supposed to be used under the position keyword. This keyword has been used as a part of TA lib. You can find more details on the same from the link shared below:
https://www.ta-lib.org/function.html

The above example will check if the previous (-1) 5 minute candle of Nifty 50 was a Dragonfly Doji.
This keyword is a technical indicator that measures both the strength and direction of a price movement and is intended to reduce false signals.
It has 3 input parameters which are :
Read more about DTI here - https://www.investopedia.com/terms/d/dmi.asp
This keyword returns the exponential moving average of any period of any series of the selected Instrument. This keyword is to be used under the position keyword

You can plot EMA on any series, like close in the above example, you can also plot EMA of RSI, OPEN etc
An exponential moving average (EMA) is a type of moving average (MA) that places a greater weight and significance on the most recent data points
Read more about EMA here -https://www.investopedia.com/terms/e/ema.asp
This keyword is used to check if a particular candle was an Engulfing candle. It is supposed to be used under the position keyword. This keyword has been used as a part of TA lib. You can find more details on the same from the link shared below:
https://www.ta-lib.org/function.html

The above example will check if the previous (-1) 5 minute candle of Nifty 50 was an Engulfing candle.
This keyword will return the latest date on which the entry legs of the selected underlying executed
The output will be a string in the format YYYY-MM-DD

This keyword will return the latest entry price of the instrument selected.
This keyword is generally used in the set exit when using a list of stocks in the strategy

The above keyword will return the respective entry prices of the stocks entered from the list
You can compare this keyword with LTP and create SL /Target conditions
This keyword will return the time of entry of the selected underlying
It will return an Integer of format HHMM

Eg- If entry happened at 2 PM it will return 1400
This keyword will return the latest Underlying spot price at the time of entry.
Generally used if the user wants to place stop loss based on Index movement rather than option prices

Suppose NIFTY 17500 CE option entered at 9:20 AM, EntryUnderlyingPrice will give the spot price at the time of this option entry, let's assume spot price was 17354 at 9:20, so in this case, EntryUnderlyingPrice will return 17354
Note - For NSE equity trades, EntryUnderlyingPrice and ENTRY PRICE keywords will return the same
Find strike keyword returns the strike based on certain parameters and values.
Find strike keyword is used under the Strike FX of the position builder

The above keyword will select the NIFTY 50 Weekly CE strike which has an LTP nearest to 150 Rs
Find strike has a filter for results where we can select which strike to select based on the output value: GREATER, LESSER, ANY
Based on the above example, since we selected ANY, it will give the output of the nearest strike whose LTP is nearest to 150rs
If we select lesser, and suppose 17000CE is 152rs and 17650 CE is 145rs, it will return 17650 as the value, 145 is lesser than the defined 150 Rs
Pls check the links below to learn more
https://help.tradetron.tech/en/article/how-to-use-find-strike-with-delta-12mg2d7/?bust=1684155602187
https://qna.tradetron.tech/t/how-to-select-strike-as-per-options-premium-value/639
Note:-
2. For equity options, their performance varies and may not be reliable. We advise against its exclusive use for this purpose.
3. Not compatible with MCX and MIDCP indices.
4. The "find strike" function maintains a data set encompassing 50 strike prices above and 50 strike prices below the At-The-Money (ATM) strike. This ATM strike is calculated daily based on the current day's opening price and remains constant for the day. Attempts to retrieve strikes exceeding this predefined range will result in a "none" output, signifying the requested strike falls outside the available data set (± 50 strikes from the ATM calculated based on the current day's opening price). If the 'any' parameter is selected, the result will be the nearest strike available in the data set.
This keyword returns the Fisher Transform indicator value of any period of the selected Instrument. This keyword is to be used under the position keyword

The above keyword will return the previous day Fisher transform value of ACC
The Fisher Transform is a technical indicator that normalizes asset prices, thus making turning points in price clearer
Read about Fisher Transform here - https://www.investopedia.com/terms/f/fisher-transform.asp
This keyword returns the name of Futures Instrument of selected underlying / list Example: FUTIDX_NIFTY_24SEP2020_XX_0

Gamma keyword returns you the gamma value of that particular option

The above example will return the gamma value of the instrument traded in 1st leg of Set 1 Entry
This keyword returns the Quantity of the selected instrument required to make the net gamma of all positions in the strategy of selected underlying to zero. Returns quantity in multiples of the lot size of Instrument as float

Usually used in QTY FX of position builder
This keyword is used to fetch the value of a runtime variable generated using python or from Tradetron API. The inputs you use here will be case and space sensitive.

In the example shared above, the keyword will look for the variable called 'tradetron' and find the number or string value associated with it.
This keyword can also be used within other keywords when the variable is fetching a particular string value. Thus if a user creates a variable called 'tradetron' and then associated an instrument name with the same, based on the example share below, the Tradetron engine will now be able to fetch the LTP of the instrument associated with the mentioned variable.

This keyword is used to fetch the numeric value of a runtime variable generated using python or from Tradetron API. The inputs you use here will be case and space sensitive.

In the example shared above, the keyword will look for the variable called 'TRADETRON' and find the number associated with it.
Get runtime number was primarily introduced to allow the get runtime feature to be used at places where it would be illogical to have a string value. In the example shared below, we can use find strike to fetch the premium of a particular number which is a runtime variable called 'TRADETRON'.

Get strike keyword returns the strike based on the value/condition set in it.
It is generally used in Strike FX of position builder.

Suppose LTP of NIFTY 50 is 17330, then the above get strike function will return 17350 as it is the nearest strike.
This keyword is used to check if a particular candle was a Gravestone Doji. It is supposed to be used under the position keyword. This keyword has been used as a part of TA lib. You can find more details on the same from the link shared below:
https://www.ta-lib.org/function.html

The above example will check if the previous (-1) 5 minute candle of Nifty 50 was a Gravestone Doji.
This keyword is used to check if a particular candle was an hammer. It is supposed to be used under the position keyword. This keyword has been used as a part of TA lib. You can find more details on the same from the link shared below:
https://www.ta-lib.org/function.html

The above example will check if the previous (-1) 5 minute candle of Nifty 50 was a hammer.
This keyword is used to check if a particular candle was a Hangingman. It is supposed to be used under the position keyword. This keyword has been used as a part of TA lib. You can find more details on the same from the link shared below:
https://www.ta-lib.org/function.html

The above example will check if the previous (-1) 5 minute candle of Nifty 50 was a Hangingman .
This keyword is used to check if a particular candle was a Harami. It is supposed to be used under the position keyword. This keyword has been used as a part of TA lib. You can find more details on the same from the link shared below:
https://www.ta-lib.org/function.html

The above example will check if the previous (-1) 5 minute candle of Nifty 50 was a Harami candle. 
The above example will check if the previous (-1) 15 minute candle of Nifty 50 futures was an inverted Harami candle.
This keyword returns the Harmonic mean of any period of any series of the selected Instrument. This keyword is to be used under the position keyword

You can fetch the Harmonic mean on any series, like close in the above example, you can also plot EMA of RSI, OPEN etc
Tradetron supports various different candle types and Heiken Ashi is one such candle type. Thus you can use any indicator, instrument or keyword and convert the candle into a Heiken Ashi candle. You can find more detail on the same candle in the lik shared below:
https://www.investopedia.com/trading/heikin-ashi-better-candlestick/
Since Heiken Ashi is an independent candle type, it can be accessed by clicking on the name of the indicator (used under position keyword) and selecting the candle type as Heiken Ashi.

In the example share above, we will fetch the High on the previous (-1) Heiken Ashi 15 mins candle for Nifty 50 spot.
This keyword returns the High value of the selected Instrument. This keyword is to be used under the position keyword

The above keyword will return the previous day High price of ABFRL
This keyword returns the Highest High value of all the values in the series of the selected Instrument. This keyword is to be used under the position keyword

You can fetch the Highest High on any series, like close in the above example, you can also plot EMA of RSI, OPEN etc.
It is important to note that the highest high value here will not include the high of the current candle (0). It will look at the maximum value of the last hundred day candles from the previous candle (-1).
This keyword returns the current Hour of the day in 24-hour format. Please make sure not to use 17:00 or something. It should be a positive integer only without any special characters

In the above example, we are checking if the current hour is greater than 1 PM, if it is strategy will enter
This keyword returns the Hull Moving average of any period of any series of the selected Instrument. This keyword is to be used under the position keyword

You can plot Hull Moving average on any series, like close in the above example, you can also plot EMA of RSI, OPEN etc
This keyword returns the Historical Volatility, the output ranges from 0 to 1.
If you want to compare with Implied volatility, make sure to multiply by 100 to get in percentage terms

This keyword will fetch the instantaneous value of any particular indicator in series at a particular time for an instrument. Since we are looking at instruments in series here, this keyword is used as a standalone keyword (not under position keyword).

According to the example shared above, the Tradetron engine will check the value of the Upper Bollinger band at 10.00 AM for Nifty Bank 5 min candle. It is important to note that this keyword should only be processed after the time mentioned (has already passed). To ensure that one must use it in group with 'AND' condition as shown below:

This keyword is used to generate a variable and assign a name and number to the same. Thus Init var is a keyword that runs only once. Thus any change made to the value of Init Var after the deployment of the strategy will only take effect after the run counter of the strategy has changed. Init var is very useful when you are using python or condition action based coding in Tradetron. Please note the values entered in Init var are case and space sensitive.

In the above example, upon deployment, the keyword will generate a runtime variable called "india" and assign a number to the same as "1"
The value can be retrieved using the get runtime keyword
This keyword will fetch a particular instrument. It is generally found within another keyword and is one of the most versatile keywords of Tradetron. If this keyword is not entered correctly or is left blank, the strategy may not be able to execute. This keyword has five distinct inputs a user can make:

Exchange:
This is the first level of segregation when you can choose what instrument you need. Tradetron offers NSE, NFO, MCX and CDS for Indian stock markets. We also offer BITBNS for crypto, FX for forex and NASDAQ-eq. One thumb rule to follow here is that, if you need to do anything related to cash market or stock equity, you can select NSE. If you list needs to take entries based on cash segment you can select NSE too. NFO can be selected if you need to do anything related to futures and options.

Underlying:
Once you select an exchange you get the flexibility to select an instrument for the same too. Here you can either select one instrument or a list of instruments. If you are selecting an equity instrument, these are the only two field that need to be filled and the other fields will automatically get disabled for you. If you are selecting an Index like Nifty 50 or Nifty Bank you can do so by selecting NFO, and then the respective index. This will fetch the spot price of that index.

Expiry:
For derivative instruments, like futures and options which have expiries, selecting these field will enable the Tradetron engine to check conditions in the relevant expiry. When selecting Nifty 50 and Nifty Bank, when you select 'Current month expiry' you will fetch the futures of the same. The same is true for MCX and CDX. In order to streamline the selection of expiry, one has the option of selecting the current week or current month expiry. Upon clicking on the same the +n th expiry dialog box opens where 0 is the current week/ month expiry, 1 is the next week/ month, 2 is the week/ month after that.

Option type:
This has two inputs, CE or PE which you can select according to what is needed.

Strike Price:
This is used to fetch the strike price of the instrument required. One can directly select a strike price or allow the same to be based on a variable, in this case ATM. When you select ATM, the at the money strike is always selected based on the current month futures of the instrument. Upon clicking on ATM, you get the option to select +/- n Steps from ATM. Here you can select a positive or negative integer to shift a strike x steps from the ATM strike. Thus +2 will fetch ATM +2 strike and so on.
This keyword is used to check if a particular candle was an inverted hammer. It is supposed to be used under the position keyword. This keyword has been used as a part of TA lib. You can find more details on the same from the link shared below:
https://www.ta-lib.org/function.html

The above example will check if the previous (-1) 5 minute candle of Nifty 50 was an inverted hammer.
IV returns the Implied volatility of a particular instrument for the selected underlying instrument.

The above example will return the implied volatility of the option traded in leg 1 of Set 1 Entry
This keyword returns the Kaufman Adaptive Moving Average of any period of any series of the selected Instrument. This keyword is to be used under the position keyword

You can plot the Kaufman Adaptive Moving Average on any series, like open in the above example, you can also plot EMA of RSI, High etc
This keyword returns the Kaufman's Efficiency indicator of any period of any series of the selected Instrument. This keyword is to be used under the position keyword

You can plot Kaufman's Efficiency indicator on any series, like close in the above example, you can also plot EMA of RSI, OPEN etc
This keyword returns the Keltner Channel value. Since there are three different Keltner channels, this keyword gives you an option to select the channel you would like to fetch. This keyword like all technical indicators are to be used under the Position keyword

The above condition is checking if the LTP of Nifty Bank is between the Previous day(-1) upper and middle Keltner Channels.

The above condition is checking if the LTP of Nifty Bank is between the Previous day(-1) middle and lower Keltner Channels.
This keyword returns the value of the Keltner Close of the selected Instrument. This keyword is to be used under the position keyword

You can plot Keltner Close on any candle of an instrument, like in the above example, you can also plot Choppiness Index of previous(-1) day candle of Nifty 50 futures
This keyword will return the latest date on which the repair legs of the selected underlying executed
The output will be a string in the format YYYY-MM-DD

It will return you the price when the instrument was last repaired. It captures the last repaired price of the instrument you are trading and not the underlying. It gets updated whenever there is a repair or an exit triggered in any set.

This keyword will return the time of repair of the selected underlying
It will return an Integer of format HHMM

Eg- If Repair happened at 2 PM it will return 1400
It will return you the underlying price of the instrument which got repaired recently. It will thus capture the spot value of nifty in this case. It will also constantly update the value of the same whenever a repair or exit trade of any set gets triggered.

Adding a target and stop-loss to your instruments have become very easy on Tradetron using the Leg Exit keyword.

Add your instrument name, set, condition and leg number and select your target or stop loss in percentage or points and assign a value to the same.

The condition builder will automatically fetch if the position is long or short and based on the same trigger your target or stop loss as needed.

Here is how your final condition is supposed to look like. Feel free to use multiple leg exits to add targets and stoplosses. Your leg will exit once whichever condition is true first.
Leg TSL / Leg Exit / Leg SL Trail — Usage Note
Use Leg TSL, Leg Exit, and Leg SL Trail only for legs that are intended to trade once. These features do not work correctly for re-entries. If you allow the same leg to enter again from the same position, the leg-exit logic may fail or cause the strategy to loop.
To prevent problems, make sure your logic includes a keyword or condition that blocks re-entry for that leg when using any of these set-exit keywords. In short: if a leg is meant to run only once, ensure it can’t re-enter from the same position — otherwise Leg Exit / Leg TSL / Leg SL Trail will not function as expected.
Video on the topic:
Using Tradetron you can now build a Trailing Stoploss on each leg of your strategy. In order to add this keyword follow the steps shared below:
Add the entry conditions and positions in your strategy
Search for keyword "Leg SL trail" in your Universal exit, repair once, set exit.

Click on the keyword and select the name of the instrument and input the location of the same

Select your TSL type:
SL - Points will calculate all values in points. (not rupees)
SL - Percentage will calculate all values in %
This is the start point of your Trail logic.
Example: If you bought a PUT at 100 and select 20 points in "stoploss", the SL will be 80. If the price goes below 80, it will exit the leg.
Now add your "Increase profit by"
This is the minimum move in your favour before which the SL will be modified from the stoploss point.
Example: If you select 5 points.Once the put goes to 105, your SL shift will be triggered.
Now add your "Increase TSL by"
The TSL will move by the points or percentage indicated here.
Example: If you select 5 points.Once the put goes to 105, your SL shift from 80 to 85 and so on.
Leg TSL / Leg Exit / Leg SL Trail — Usage Note
Use Leg TSL, Leg Exit, and Leg SL Trail only for legs that are intended to trade once. These features do not work correctly for re-entries. If you allow the same leg to enter again from the same position, the leg-exit logic may fail or cause the strategy to loop.
To prevent problems, make sure your logic includes a keyword or condition that blocks re-entry for that leg when using any of these set-exit keywords. In short: if a leg is meant to run only once, ensure it can’t re-enter from the same position — otherwise Leg Exit / Leg TSL / Leg SL Trail will not function as expected.
This is what your final condition will look like, no need to add comparators, just Leg SL trail condition.

Using Tradetron you can now build a Trailing Stoploss on each leg of your strategy. In order to add this keyword follow the steps shared below:
Add the entry conditions and positions in your strategy
Search for keyword "leg TSL" in your Universal exit, repair once, set exit.

Click on the keyword and select the name of the instrument and input the location of the same

Select your TSL type:
TSL - Points will calculate all values in points. (not rupees)
TSL - Percentage will calculate all values in %
This is the start point of your TSL.
Example: If you bought a PUT at 100 and select 20 points in "activate at", the TSL will begin only when your PUT trades above 120.
This will exit your position if the price moves against you for more than the selected % or points from the activate at level.
Example: If your bought PUT's TSL is activated at 20 points the LTP begins to move below 110, "Lock profit at" will exit at 10 points or 10% in profit.
Now add your "Increase profit by"
This is the minimum move in your favour before which the TSL will be modified.
Now add your "Increase TSL by"
The TSL will move by the points or percentage indicated here.
Leg TSL / Leg Exit / Leg SL Trail — Usage Note
Use Leg TSL, Leg Exit, and Leg SL Trail only for legs that are intended to trade once. These features do not work correctly for re-entries. If you allow the same leg to enter again from the same position, the leg-exit logic may fail or cause the strategy to loop.
To prevent problems, make sure your logic includes a keyword or condition that blocks re-entry for that leg when using any of these set-exit keywords. In short: if a leg is meant to run only once, ensure it can’t re-enter from the same position — otherwise Leg Exit / Leg TSL / Leg SL Trail will not function as expected.
This is what your final condition will look like, no need to add comparators, just Leg TSL condition.

Video on the topic:
https://youtu.be/M2PlEGXmSNc
Tradetron supports various different candle types and Line Break is one such candle type. Thus you can use any indicator, instrument or keyword and convert the candle into a Line Break candle.
Since Line Break is an independent candle type, it can be accessed by clicking on the name of the indicator (used under position keyword) and selecting the candle type as Line Break .

In the example share above, we will fetch the High on the previous (-1) Line Break 5 mins candle with price lines as 3 for Nifty 50 spot.
You can find more detail on the same candle in the link shared : www.definedge.com/introduction-to-line-break-charts/
This keyword returns the Linear Regression of any period of any series of the selected Instrument. This keyword is to be used under the position keyword.
This keyword has been used as a part of TA lib. You can find more details on the same from the link shared below:
https://www.ta-lib.org/function.html

You can fetch the Linear regression on any series, like close in the above example, you can also plot EMA of RSI, OPEN etc
This keyword returns the Linear Regression Slope of any period of any series of the selected Instrument. This keyword is to be used under the position keyword.
This keyword has been used as a part of TA lib. You can find more details on the same from the link shared below:
https://www.ta-lib.org/function.html

You can fetch the Linear Regression Slope on any series, like close in the above example, you can also plot EMA of RSI, OPEN etc
This keyword returns the Linear Regression Angle of any period of any series of the selected Instrument. This keyword is to be used under the position keyword.
This keyword has been used as a part of TA lib. You can find more details on the same from the link shared below:
https://www.ta-lib.org/function.html

You can fetch the Linear Regression Angle on any series, like close in the above example, you can also plot EMA of RSI, OPEN etc
This keyword returns the Linear Regression Intercept of any period of any series of the selected Instrument. This keyword is to be used under the position keyword.
This keyword has been used as a part of TA lib. You can find more details on the same from the link shared below:
https://www.ta-lib.org/function.html

You can fetch the Linear Regression Intercept on any series, like close in the above example, you can also plot EMA of RSI, OPEN etc
This keyword will return the log of the selected series of the particular instrument. Log keyword is generally used under the position keyword

The above condition will return log of previous day's NIFTY 50 close price
Log keyword used in Tradetron is part of Numpy library -https://numpy.org/doc/stable/reference/generated/numpy.log.html
This keyword will return the log Returns of the selected series of the particular instrument. Log Return keyword is generally used under the position keyword


Log return can be used on any series like OPEN,EMA etc.
The above condition will return log return of previous day's NIFTY 50 close price
This keyword will fetch the current lot size of an instrument and return an integer number of the same. Lot size can be used in combination with other keywords to make comprehensive formulae to achieve a specific mathematical operation. Its specially useful when using lists and will only work on futures and option instruments.

The above image is of the keyword to find the lot size of Nifty 50 current month futures.
 The above image is of the keyword to find the lot size of Nifty 50 current week ATM CE.
This keyword returns the Low value of the selected Instrument. This keyword is to be used under the position keyword

The above keyword will return the previous day Low of ABFRL
This keyword returns the Lower Bollinger value of any period of any series of the selected Instrument. This keyword is to be used under the position keyword

You can plot Lower Bollinger on any series, like close in the above example, you can also plot Lower Bollinger of RSI, OPEN etc
Bollinger Bands are envelopes plotted at a standard deviation level above and below a simple moving average of the price.
Read more about Bollinger Bands here - https://www.fidelity.com/learning-center/trading-investing/technical-analysis/technical-indicator-guide/bollinger-bands
This keyword returns the Lowest Low value of all the values in the series of the selected Instrument. This keyword is to be used under the position keyword

You can fetch the Lowest Low on any series, like close in the above example, you can also plot EMA of RSI, OPEN etc.
It is important to note that the lowest low value here will not include the low of the current candle (0). It will look at the minimum value of the last hundred day candles from the previous candle (-1).
This keyword returns the Least Square Moving Average of any period of any series of the selected Instrument. This keyword is to be used under the position keyword

You can plot LSMA on any series, like High in the above example, you can also plot LSMA of RSI, OPEN etc
This Keyword returns the Last Traded Price of the selected Instrument. You can use it under condition builder to check the LTP of that particular instrument

Note - To check the Spot index price, just select NFO, NIFTY 50. If you want to check futures price, select NFO,NIFTY 50, Current month expiry. Selecting current month expiry will return its future price
Refer to the below links for more clarity
Spot price -https://qna.tradetron.tech/t/how-to-select-nifty-bank-spot/622
Future price- https://qna.tradetron.tech/t/how-to-select-nifty-futures/810/2
This keyword returns the MACD line value of any period of any series of the selected Instrument. This keyword is to be used under the position keyword

You can plot MACD line on any series, like close in the above example, you can also plot MACD line based on series of RSI, OPEN etc
Moving average convergence divergence (MACD) is a trend-following momentum indicator that shows the relationship between two moving averages of a security’s price.
Read here for more info on MACD - https://www.investopedia.com/terms/m/macd.asp
This keyword returns the MACD Histogram value of any period of any series of the selected Instrument. This keyword is to be used under the position keyword

You can plot MACD Histogram on any series, like close in the above example, you can also plot MACD Histogram based on series of RSI, OPEN etc
Moving average convergence divergence (MACD) is a trend-following momentum indicator that shows the relationship between two moving averages of a security’s price.
Read more about MACD here - https://www.investopedia.com/terms/m/macd.asp
This keyword returns the MACD Signal Line value of any series of the selected Instrument in any timeframe. This keyword is to be used under the position keyword

You can plot MACD Signal line on any series, like close in the above example, you can also plot MACD Signal line based on series of RSI, OPEN etc
Moving average convergence divergence (MACD) is a trend-following momentum indicator that shows the relationship between two moving averages of a security’s price.
Read more about MACD here - https://www.investopedia.com/terms/m/macd.asp
This keyword is used to perform a mathematical operation on two inputs/keywords. The output of math operation keyword is a float.
It can also be used under the round keyword to get a rounded output rather than a decimal value.

In the example shared above, we are adding 5 and 15, so the output will be 20
This keyword is used to perform a mathematical operation on two series data types. Since we are performing a mathematical operation on two series values, you need to use Position keyword here and select math series operation in the same.

In the example shared above, we are taking the difference between the 20 period EMA of daily Nifty 50 spot candles and the 25 period SMA of daily Nifty 50 spot candles.
This keyword returns the maximum value of the two inputs.

The above condition will return the maximum value, in this case, 1500
You can also input different series like CLOSE, EMA and find the maximum of the two. Make sure to use the position keyword while selecting series as input


This keyword will return the instrument with the maximum open interest at that instant. You can input the underlying instrument, expiry and option type. Your request will be processed and a response will be fetched. At the moment it is only available for indices.

The above image shows how to fetch the instrument with max OI for Nifty Bank, current month put options.
This keyword will return a numerical value of the strike of the instrument with the maximum open interest at that instant. You can input the underlying instrument, expiry and option type. Your request will be processed and a numeric response will be fetched. At the moment it is only available for indices. This keyword can also be used in the strike fx of the position builder.

The above image shows how to fetch the maximum OI strike for Nifty 50, current week call options.
This keyword will fetch the maximum profit achieved by the strategy during one run counter of the same. Max profit is a strategy level keyword and will take into account the total realized and unrealized profit of all positions taken. It is suggested to use Max profit to define a custom trailing stop loss on a strategy. Max profit should ideally be multiplied with the multiplier as shown in the image below in the Universal exit of a strategy.

Another utility for this keyword is to build a custom trailing stoploss logic. This is very similar to the TSL feature in the advance settings however certain customizations in the same are not possible. Using the Max profit keyword one can customize the levels at which TSL gets triggered.

In the example share above, the condition on line one checks if the max profit of the strategy is greater than 2500. This is the activation price of the TSL mechanism. One can thus select any number at which he wants his TSL to get activated.
Line number two checks the difference between the values of the max profit and the PNL of the strategy. If the difference between the two is greater than 1000, the universal exit will be activated. This number can also be modified based on the logic of a strategy. Thus if you need the TSL to be very sensitive the number can be a smaller number like 200 or 500. If you need the TSL to be more accommodative, you can select a larger number.
We are multiplying the two by multiplier to scale the same up or down as per the position sizing selected.
This keyword returns the monthly futures expiry date of the instrument as a string in the format YYYY-MM-DD
This keyword can be used in condition builder as well as in expiry FX of the position builder

The above example can be used in condition builder to check if the current day is the monthly expiry of the MCX instrument

The above condition can be used in the expiry FX of the position builder to trade next month expiry
This keyword returns the current weekly expiry date of the instrument as a string in the format YYYY-MM-DD
Please make sure to only use instruments in this that are traded in option derivatives.
This keyword can be used in condition builder as well as expiry FX in position builder

The above example can be used in condition builder to check if current day is MCX option expiry day
This keyword will return the rolling mean of the series selected of the particular instrument.
This keyword has 2 inputs, one is to select the series, other is to select the period which is the no. of previous values to consider or the sample

The above condition will return the mean of the NIFTY 50 close series, considering the sample data of the past 20 three minute candles
This keyword will return the median of the series selected of the particular instrument.
This keyword has 2 inputs, one is to select the series, other is to select the period which is the no. of previous values to consider or the sample

The above condition will return the median of the NIFTY 50 close series, considering the sample data of the past 20 candles of 1 min timeframe
This keyword returns the Money Flow Index value of the instrument. This keyword like all technical indicators are to be used under the Position keyword

The above condition is checking if the Previous day(-1) MFI value is greater than 80 for Nifty 50 futures.
The Money Flow Index (MFI) is a technical oscillator that uses price and volume data for identifying overbought or oversold signals in an asset.
Read more about Money Flow Index (MFI) here -https://www.investopedia.com/terms/m/mfi.asp
This keyword returns the minimum value of the two inputs.

The above condition will return the minimum value, in this case 50
You can also input different series like close, EMA and find the minimum of the two. Make sure to use position keyword while selecting series as input
This keyword Returns current minutes as an integer

The above example is checking whether the current minute is greater than 30, suppose time is 11:45, condition will be true
Please note, the range is 1 - 59
This keyword returns the current month as an integer from 1 to 12. January Is Month Number 1, February is 2 and naturally, December is 12. Please make sure not to use 1.00 or something. It should be a positive integer only.
The below example is checking whether the current month is November

This keyword is used to check if a particular candle was a Morningstar Doji candle. It is supposed to be used under the position keyword. This keyword has been used as a part of TA lib. You can find more details on the same from the link shared below:
https://www.ta-lib.org/function.html

The above example will check if the previous (-1) 5 minute candle of Nifty 50 was an Morningstar Doji candle
This keyword is used to check if a particular candle was a Morningstar candle. It is supposed to be used under the position keyword. This keyword has been used as a part of TA lib. You can find more details on the same from the link shared below:
https://www.ta-lib.org/function.html

The above example will check if the previous (-1) 5 minute candle of Nifty 50 was an Morningstar candle
Multiplier is the keyword used when we want to multiply any value in the strategy as per the multiplier selected during that deployment.
Useful, if the user wants to deploy using different multiplier like 2X,5X etc
If deployment is under 2X, multiplier will return 2

This keyword is used to multiply a value to the entire series /array of the selected instrument. This keyword is used under the position keyword

The above example will multiply 10 to all the close values of the NIFTY 50 series
This keyword will return Net Delta of open positions of the selected underlying for the strategy

If a position is long CE = Net Delta of CE position will be positive
If a position is short CE = Net Delta of CE position will be negative
If a position is long PE = Net Delta of PE position will be negative
If a position is short PE = Net Delta of PE position will be positive
Net delta will give the summation of all open positions (quantity) multiplied by their respective delta for that underlying

This keyword will return Net Gamma of open positions of the selected underlying for the strategy


It returns the Net quantity/Open Quantity of that particular instrument in that strategy. Please note that this keyword will give you Net Quantity of that instrument in whole strategy not at Set Level.

The above example will return the net quantity of ADANIENT in the strategy.

The above example will return the net quantity of the instrument traded in leg 1 of set 1 in the entry which has NIFTY50 as underlying. It will take that particular leg reference and fetch what is the instrument being Traded. Following that it will scan full strategy and return Net Quantity of that particular instrument.
Suppose 1 lot NIFTY 17000CE is sold in entry leg 1, it will return -50
If the same traded instrument is squared off it in some other condition, it will return 0
Usage Note
Net QTY is a strategy-level keyword. It reads the instrument name from the referenced position and then scans the entire strategy to calculate the total active quantity for that instrument.
Net QTY is not a set-level or position-level keyword — it returns the aggregate quantity for the instrument across the whole strategy.
This keyword returns the Net Theta of open positions in selected underlying for strategy.
Eg. Net Theta('NIFTY 50') as float


This keyword will return Net Vega of open positions of the selected underlying for the strategy


Next Trading Day returns the next trading date in string format. It cannot be equated with any number. The keyword you are comparing with should also return a string only
It will return the current date as a string in format YYYY-MM-DD

It can be used as follows:
This will check if tomorrow is the next trading day. If yes the conditions will be true.

The above logic can be used in case of situations when there is a holday on a day before expiry. The above logic will help you ensure your tade happens one day previos to the expiry date accounting for the holiday.
This keyword returns current date and time as an integer as YYYYMMDDHHMM.

This keyword is the simplest of all and just returns the number that is input by the user.
This keyword can be used to define or compare with a value output of an existing keyword

In the above condition, the number keyword is used to check if the PNL keyword is more than 500.
This keyword returns the value of the On Balance Volume of the selected Instrument. This keyword is to be used under the position keyword

You can plot Choppiness Index on any candle of an instrument, like in the above example, you can also plot OBV of previous (-1) day candle of Nifty 50 futures
This keyword can be used for all series based technical indicator's. It will fetch the value of a particular candle in series for two independent instruments and find the difference of the same values. You can thus check the difference in premium of two strikes. This difference could be either positive or negative.
This keyword is nested within most series or technical indicators. In order to OHLC spread, you need to select position keyword and then select the series/indictor for which you need to find the spread between the two instruments. Post that click on the indicator to select keyword 'OHLC Spread'.


As shown in the above example, you can find the previous 5 minute open of the current week ATM CE and PE for the weekly option for Nifty Bank and find the difference in the same values.
This keyword can be used for all series based technical indicator's. It will fetch the value of a particular candle in series for two different instruments and sum it up. You can thus check the combined premium of two strikes.
This keyword is nested within most series or technical indicators. In order to OHLC sum, you need to select position keyword and then select the series/indictor for which you need to find the spread between the two instruments. Post that click on the indicator to select keyword 'OHLC Sum'.


As shown in the above example, you can find the previous 5 minute close of the current week ATM CE and PE for the weekly option for Nifty 50 and sum it up.
This keyword returns the Open value of the selected Instrument. This keyword is to be used under the position keyword

The above keyword will return previous day Open price of ABFRL
This keyword will look at all the open positions within the strategy that you have defined and return an absolute integer number. The values it will fetch here will be Boolean values. Thus this keyword can only check if there is an open position for an instrument. If there is an open position then it will fetch 1, else 0.
Assume you trade one lot of RELIANCE futures. When you enter into RELIANCE, the Open Positions keyword will return number 1 as you have 1 open position. Assume you square off the position in RELIANCE futures, the Open Positions keyword will return number 0.

Through the above keywords, one can check if there are no Open Positions for RELIANCE

Through the above keywords, one can check if there are Open Positions for RELIANCE
The Open Positions keyword should not be used restrict the number of positions taken in a strategy as shown below.

To understand the rationale behind the same, take this example:
A strategy took an entry in RELIANCE futures and then exited from the same. Post that it takes a re entry in RELIANCE futures. In this case logically speaking, the number of open positions returned should be 1. However the Tradetron engine will not consider the open positions as 1 and will return 3 as it detects three unique entries.
This keyword will help you fetch the Open, High, Low, Close or Volume of any particular timeframe. It is important to execute the ORB keyword only after the mentioned time has passed. Thus it is suggested to add a time condition along with the ORB condition as an AND.
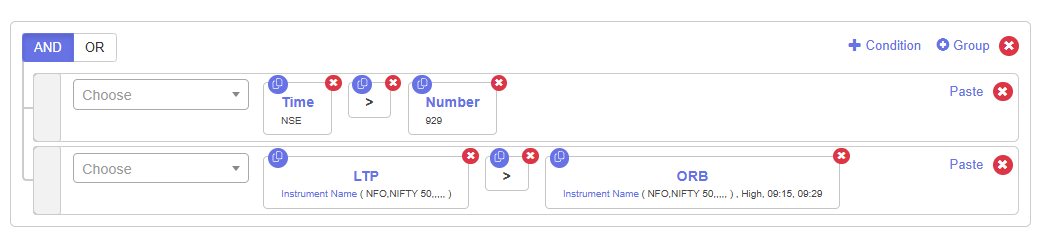
In the example share above, we are looking for the condition where the LTP of Nifty 50 spot is greater than the high between 915 AM and 930AM. We are also looking for the same to execute only if its 930AM.
You can have a look at this video for more details.
This keyword will return a numerical value of the PUT-CALL ratio based on open interest at that instant. You can input the underlying instrument and expiry. Your request will be processed and a numeric response will be fetched. At the moment it is only available for indices.
 The above image shows how to build a condition to check the PCR Nifty 50, current week options and take a trade if the same is greater than or equal to 1.25.
This keyword returns the Percentage Price Oscillator of any period of any series of the selected Instrument. This keyword is to be used under the position keyword

You can plot Percentage Price Oscillator on any series, like close in the above example, you can also plot EMA of RSI, OPEN etc
This keyword will return the Percentile value of the selected value from series of the particular instrument. Percentile Rank keyword need not be used under the position keyword
This keyword has 3 inputs, one is to select the series, another one to select the period which is the no. of previous values to consider or the sample and the final to input the value whose percentile needs to be found

The above condition will return the Percentile Rank of 250 value of the ITC close series, considering the sample data of the past 20 candles
Eg- Suppose 250 is the highest close value of ITC in past 20 candles, then it will return 100, as it is 100 percentile
This keyword returns the Pivot Points value of the selected Instrument for the selected timeframe. This keyword is to be used under the position keyword
In this keyword, you can select from 3 types of pivot points

The above keyword will return the Fibonacci pivot value of NIFTY 50 based on day before yesterdays daily candle, if you want to find pivot for current day, use position 0 and it will automatically create pivot based on previous day's data
The general rule of thumb is to calculate pivot points based on the previous day’s daily timeframe for the current day. Always use the daily timeframe when calculating pivot points, and avoid using lower timeframes (e.g., 2-minute or 3-minute charts).
A pivot point is a technical analysis indicator, or calculations, used to determine the overall trend of the market over different time frames.
Read more about Pivot Points here - https://www.investopedia.com/terms/p/pivotpoint.asp
This keyword will return profit/loss of the strategy for that counter
Generally used when the user wants to exit the strategy when the target/stop loss amount reached for that particular strategy as a whole if we keep the condition in the universal exit.
PNL is a strategy level keyword, generally kept in universal exit, even if kept in set exit, it will still return the overall profit/loss combining all the sets.
This keyword will reset only after universal exit.
Please click on this link for more and examples - https://qna.tradetron.tech/t/how-to-use-pnl-keyword/635

The above code if put in universal exit, will exit the strategy if it makes 500 Rs + profit
It is also advisable to use PNL keyword with multiplier to make sure that the targets/ stoploss is scaled up based on the multiplier selected.
This keyword will return profit/loss of the strategy for that counter for only the instrument that has been selected here.
Generally used when the user wants to exit the strategy when the target/stop loss amount reached for that particular strategy as a whole if we keep the condition in the set exit.
PNL is a strategy level keyword, generally kept in set exit, to exit all open positions of the underlying instrument while keeping all other positions untouched.
This keyword will reset only after universal exit.

In the example share above, the system will trigger and exit when the PNL of all HDFCBANK instruments are greater than or equal to 500.
Position keyword one of the most fundamental and most used keyword in Tradetron
Position keyword is used to pinpoint and get the data of a particular position from a series
Most technical indicators, OHLCV data is retrieved using this position keyword
Position keyword has 2 inputs, one is to select the data series like close, EMA, SMA etc and the next is to pinpoint the position to retrieve the data

Selecting -1 indicates the previous candle. -2 indicates previous to the previous candle and so on.
Selecting 0 indicates the current candle, so basically, position( close)0 is the same as LTP
Please note position input cannot be positive, it has to be 0 or a negative number

In the above example, the position keyword is used to get the previous day close value of the Nifty 50 futures chart
Pls read this blog for more clarity - https://blog.tradetron.tech/node/21
The position detail keyword is one of the most important and versatile keywords of Tradetron. The same keyword can be used in various ways to control what your strategy does in a very precise ways. This keyword is a strategy level keyword which means that is is independent of sets and will take into consideration, all the positions within a strategy. In most keywords, a users is typically adds an input and hence receives an output in the form of the result. However while using position detail, one must first think of what is the output that the user wants to achieve and then built and input in position detail for the same.
Position detail has 4 inputs namely Condition type, Transaction Type, Instrument type and Underlying and 3 outputs Value, Quantity and Count of which anyone can be selected at a time

In order to explain the same consider the following cases:
Assume you buy one lot of Nifty 50 Monthly CE that has a lot size of 50.
Now if you use the position detail keyword with these settings, it will fetch number +50 as the system is looking at all the conditions in the strategy, all transactions and all instrument types.

However if I modify the filter to check for only entries and sell type transactions, the position detail keyword will return 0. This is because even though there is an entry here, there is no Sell in the strategy thus fetching 0.

Similarly if I modify the same keyword to look for entries of Buy transactions but the instrument is selected as PE, it will again return 0. This is because no PE has been currently traded in the strategy.

Now assume that the same Nifty 50 Monthly CE has been squared off by the repair once condition.
Now if I add the same keyword, with the settings shown above, it will fetch 0. This is because we are looking for the positions of 'all' condition types in the strategy. Thus the entry condition will fetch number +50(since we went long) and the repair condition will fetch -50(since we went short). When we look for the summation of all the condition types, we get (+50) + (-50) thus returning 0
 If I select repair once as the condition type and keep the transaction and instrument type as all, the same keyword will return -50 and there was a short position taken in the repair once trade.

Using the above cases we are trying to point to the fact that position detail can be used effectively to check if certain positions are taken or not taken. Based on the same you get granular logical control over the positions being taken by your strategy at every point.
Position detail in a strategy level keyword and not a set level keyword. No matter which set you use it in, it will return the output based on all the sets ie. the strategy.
Let us understand the use of position detail with an example
#Example 1
Suppose you have 2 sets in a NIFTY 50 straddle strategy where each set is selling a straddle and you want that only 1 set must be active at a time, then you can use the below position detail configuration in the entry of both the sets

In the above configuration, we are basically checking the net quantity of the strategy whether it is 0 or not. If it is 0, that means no set is active and anyone set can be active.
Suppose set 2 enters then position detail will return -100 as it is CE and PE sell each 1 lot so net quantity is -100. Now after some time set exit happens and positions are squared off then the net quantity becomes 0.
#Example 2
Suppose you have a 1 set strategy where you are building a long straddle. Now you wish that set 1 enters only once per day.
So in set 1 since it is buying CE and PE, we will use the below configuration in set 1 entry conditions
In this arrangement, we are selecting Entry and B because when buy legs are traded for the first time, Position detail keyword will return 0 as no trades have occurred and thus it will allow first entry. Now as soon as set 1 entry happens the position detail keyword will return 100 as ENTRY, B, ALL, Quantity = 100, thus condition will not be satisfied for the second entry, preventing re-entry for set 1
The above keyword will scan only the Entry blocks of both sets and return the Buy quantity
#Example 3
Suppose you are trading a list of stocks and want to limit the number of entries by 5 for the day/counter. You can use the count function of position detail. It is generally used when using a list of stocks.

The above keyword will limit the entries to 5. Count function will give the output of no. of times unique instruments have been traded.
For simplicity Position detail count will return the no. of rows in the deployed page, consider the image below.

In the above image, 5 rows are visible. Position detail count will return 5 as 5 unique instruments (stocks) have been traded. Even if LT from that list entered, exited 3 times, Position detail Count will still return 5 as unique instruments are only 5.
Note: Suppose 6 stocks satisfy at an instant, position detail count will allow entry for all 6 stocks instead of 5 and next condition check it won't allow entry. To have a foolproof method of limiting entry, you need to decrease the size of the list such that the probability of multiple stocks satisfying conditions at the same instance is reduced or can go for custom coding.
You can use the same logic for restricting entry in option strategy. But note that Option instruments are unique if strike, expiry option type is different.
This keyword is used to take the power of the entire series /array of the selected instrument by a value. This keyword is to be used under the position keyword

The above example will take the close values of the NIFTY 50 series and raise it by a power of 2 and output the -1 value

This will return the close price of the previous day of that selected instrument.

 This keyword returns the date of the last historic expiry of an expired instrument as a string in the format YYYY-MM-DD.

In here you can input your instrument name, the expiry type and the offset of the expiry. 0 will give you the latest expired expiry, 1 will give you the previous to previous expiry and so on.
Note: You cannot add a negative number in the offset
This keyword is mainly used to check if today is the first day of a new series of a monthly or weekly contract.

You can use the Previous Expiry keyword in days difference if you have strategies where the entry trade has to happen on the day after the expiry.
This keyword will return a random number that can be used for complex mathematical operations as a part of a formula that requires a randomly changing number. It will only return absolute decimal numbers from 0 to 1.00

The ratio keyword as the name suggests will output the ratio of 2 inputs in a series. It is generally under the position keyword.

The above condition will return the Ratio of open and close for the previous day.
Tradetron supports various different candle types and Renko is one such candle type. Thus you can use any indicator, instrument or keyword and convert the candle into a Renko candle. You can find more detail on the same candle in the link shared below:
Since Renko is an independent candle type, it can be accessed by clicking on the name of the indicator (used under position keyword) and selecting the candle type as Renko. To fetch the latest Renko brick, it is suggested to use it with Position (0).

In the example share above, we will fetch the current (0) Renko brick for Nifty 50 spot.
This keyword will allow the brick size to be maintained as a fixed value. In order to modify the same value, click on 'Renko' and select the number which you need to keep a the brick size.

Tradetron supports various different candle types and Renko is one such candle type. Thus you can use any indicator, instrument or keyword and convert the candle into a Renko candle. You can find more detail on the same candle in the link shared below:
Since Renko is an independent candle type, it can be accessed by clicking on the name of the indicator (used under position keyword) and selecting the candle type as Renko. Renko closed keyword skips ongoing candle for Renko OHLC formation thus the same can be used to avoid the repainting issue on Renko bricks.

In the example share above, we will fetch the the current (0) Renko closed brick for Nifty 50 spot.
This keyword will allow the brick size to be maintained as a variable. In order to modify the same, click on 'Renko- Closed bricks' and select the number/ series which you need to keep as the brick size.

Tradetron supports various different candle types and Renko is one such candle type. Thus you can use any indicator, instrument or keyword and convert the candle into a Renko candle. You can find more detail on the same candle in the link shared below:
Since Renko is an independent candle type, it can be accessed by clicking on the name of the indicator (used under position keyword) and selecting the candle type as Renko. Brick size in 'Renko dynamic bricks' can be configured to be based on custom formula instead of a fixed number.

In the example shared above, we will fetch the the current (0) Renko closed brick for Nifty 50 spot. Here the brick size will be a variable fetched from the value of ATR of the current (0) candle of Nifty 50 spot on 5 min timeframe.
This keyword will allow the brick size to be maintained as a variable. In order to modify the same, click on 'Renko Dynamic bricks' and select the formula which you need to keep as the brick size.

Required Capital keyword returns the amount set in "Capital Required" field of advanced settings in the strategy.
This keyword has to be used with multiplier keyword.

Rho keyword returns the Rho value of the particular option

This keyword returns the Rate of change of any period of any series of the selected Instrument. This keyword is to be used under the position keyword

ROC = ((price/prevPrice)-1)*100
This keyword function is a part of TA LIB - https://www.ta-lib.org/function.html
You can plot ROC on any series, like close in the above example, you can also select ROCP of RSI, OPEN etc
This keyword returns the Rate of change Percentage of any period of any series of the selected Instrument. This keyword is to be used under the position keyword

ROCP = (price-prevPrice)/prevPrice
This keyword function is a part of TA LIB - https://www.ta-lib.org/function.html
You can plot ROCP on any series, like close in the above example, you can also select ROCP of RSI, OPEN etc
This keyword will round off the values to the base you select.

In the above example, we have rounded off the spot value to Nifty 50 to the nearest 50 rupees.
This keyword returns the RSI of any period of the selected Instrument. This keyword is to be used under the position keyword.

The above keyword will return the previous day RSI 14 value of ACC.
RSI keyword needs at least 2 as an input in period, RSI with period 1 won't work.
The RSI provides technical traders with signals about bullish and bearish price momentum, and it is often plotted beneath the graph of an asset’s price.
Read more about RSI here -https://www.investopedia.com/terms/r/rsi.asp
This keyword returns the RSI series of any period of any selected Instrument. This keyword is to be used under the position keyword

The major difference between the RSI keyword and the RSI series keyword is that in the RSI series we can take RSI of different series like OPEN, HIGH ,EMA, while the RSI keyword just takes the Close values as default.
The RSI provides technical traders with signals about bullish and bearish price momentum, and it is often plotted beneath the graph of an asset’s price.
Read more about RSI here -https://www.investopedia.com/terms/r/rsi.asp
This keyword returns the Parabolic SAR indicator value of the selected Instrument for the selected timeframe. This keyword is to be used under the position keyword

The above keyword will return the previous day SAR value of ABFRL
The parabolic SAR (stop and reverse) indicator is used by technical traders to spot trends and reversals.
Read more about SAR here -https://www.investopedia.com/terms/p/parabolicindicator.asp
Sec returns current seconds as an integer

The above condition is checking whether the current seconds is greater than 30, suppose if the time is 11:45:32, the condition will be true.
Please note, the range is 1 - 59
This keyword is used to check if a particular candle was a Shootingstar candle. It is supposed to be used under the position keyword. This keyword has been used as a part of TA lib. You can find more details on the same from the link shared below:
https://www.ta-lib.org/function.html

The above example will check if the previous (-1) 5 minute candle of Nifty 50 was an Shootingstar candle
This keyword returns the simple moving average of any period of any selected Instrument. This keyword is to be used under the position keyword

You can plot SMA on any series, like close in the above example, you can also plot SMA of RSI, OPEN etc
A simple moving average is a technical indicator that can aid in determining if an asset price will continue or if it will reverse a bull or bear trend.
Read more about SMA here - https://www.investopedia.com/terms/s/sma.asp
This keyword is used to take a square root of the entire series /array of the selected instrument. This keyword is to be used under the position keyword


The above example will take the square root of all the close values of the NIFTY 50 series and output the -1 value
This keyword returns the Supertrend value of the instrument selected. The supertrend will be calculated based on SMA. Like, most technical indicators this has to be used under the Position keyword.

The above keyword is checking whether the previous day close of the NIFTY 50 spot is greater than its Supertrend value
Super Trend is a trend following indicator similar to moving averages
Read about Supertrend here - https://www.elearnmarkets.com/blog/supertrend-indicator-strategy-trading/
This keyword will return the rolling standard deviation of the series selected of the particular instrument.
STDEV is generally used under position keyword
This keyword has 2 inputs, one is to select the series, other is to select the period which is the no. of previous values to consider or the sample

The above condition will return the standard deviation of the NIFTY 50 close series, considering the sample data of past 20 candles
This keyword returns the Stochastic Oscillator value of the D line. This keyword like all technical indicators are to be used under the Position keyword

The above condition is checking if Previous day(-1) Stochastic Oscillator value of the D line is greater than Previous day(-1) Stochastic Oscillator value of the K line
A stochastic oscillator is a popular technical indicator for generating overbought and oversold signals.
Read more about Stock K and D here -https://www.investopedia.com/terms/s/stochasticoscillator.asp
This keyword returns the Stochastic Oscillator value of the K line. This keyword like all technical indicators are to be used under the Position keyword

The above condition is checking if Previous day(-1) Stochastic Oscillator value of the K line is greater than Previous day(-1) Stochastic Oscillator value of the D line
A stochastic oscillator is a popular technical indicator for generating overbought and oversold signals.
Read more about Stock K and D here -https://www.investopedia.com/terms/s/stochasticoscillator.asp
This keyword returns the Stochastic Oscillator value of the D line plotted on RSI. This keyword like all technical indicators are to be used under the Position keyword

The above condition is checking if Previous day(-1) Stochastic Oscillator value of the K line is greater than Previous day(-1) Stochastic Oscillator value of the D line both plotted on RSI.
A stochastic oscillator is a popular technical indicator for generating overbought and oversold signals. These indicators are plotted on RSI.
Read more about Stock K and D here -https://www.investopedia.com/terms/s/stochasticoscillator.asp
This keyword returns the Stochastic Oscillator value of the K line plotted on RSI. This keyword like all technical indicators are to be used under the Position keyword

The above condition is checking if Previous day(-1) Stochastic Oscillator value of the D line is greater than Previous day(-1) Stochastic Oscillator value of the K line both plotted on RSI.
A stochastic oscillator is a popular technical indicator for generating overbought and oversold signals. These indicators are plotted on RSI.
Read more about Stock K and D here -https://www.investopedia.com/terms/s/stochasticoscillator.asp
This keyword is used to subtract a value from the entire series /array of the selected instrument. This keyword is used under the position keyword

The above example will subtract 10 from all the close values of the NIFTY 50 series.
Suppose Nifty yesterday's close value is 17000, it will return 17000-10= 16950
This keyword will return the sum of the series selected of the particular instrument.
SUM is generally used under the position keyword
This keyword has 2 inputs, one is to select the series, other is to select the period which is the no. of previous values to consider to add

The above condition will return the sum of the previous 3 close prices of NIFTY 50
This keyword returns the Supertrend value of the instrument selected. The supertrend will be calculated based on EMA. Like, most technical indicators this has to be used under the Position keyword

The above keyword is checking whether the previous day close of the NIFTY 50 spot is greater than its Supertrend value
Super Trend is a trend following indicator similar to moving averages
Read about Supertrend here - https://www.elearnmarkets.com/blog/supertrend-indicator-strategy-trading/
This keyword is used in order to fetch the data for a particular time frame based on the selected instrument(Instrument name, traded instrument name, futures).
Generally, symbol will be used inside the other keywords to select the instrument of choice.
The symbol keyword will be a default keyword under most keywords. It will be available by default wherever instrument needs to be selected.

In the above condition, symbol keyword is used to select the timeframe and the instrument name.
This keyword will calculate the put call parity and fetch the synthetic futures of the current week based on the same. This can be used to calculate weekly futures and trade based on the same to spot arbitrage opportunities.

The above image shows how can you use synthetic futures as a standalone keyword for other mathematical operations.

The above image shows how can you use synthetic futures to calculate the ATM strike based on the same.
This keyword returns the Triple Exponential Moving Average value of the instrument. This keyword like all technical indicators are to be used under the Position keyword

The above condition is checking if the Previous 5 minute (-1) TEMA value is greater than previous to previous 5 minute (-2) TEMA value of Gold futures
The triple exponential moving average (TEMA) is a modified moving average designed to smooth large price fluctuations.
Read more about TEMA here - https://www.investopedia.com/ask/answers/041315/why-triple-exponential-moving-average-tema-important-traders-and-analysts.asp
Theta keyword returns you the Theta value of that particular option

The above example will return the Theta value of the instrument traded in 1st leg of Set 1 Entry
Quantity of selected instrument required to make net Theta of all positions in the strategy of selected underlying to zero. Returns quantity in multiple of lot size of Instrument as float
Usually used in QTY FX of position builder

The above example will return the quantity of NIFTY 50 futures required to make the positions of the underlying Theta neutral in the strategy
This keyword will fetch the minimum tick size of an instrument and return a number for the same. Tick size can be used in combination with other keywords to make comprehensive formulae to achieve a specific mathematical operation. Its specially useful when using lists with multiple instruments.

The keyword shared above will find the minimum tick size for all the instruments within the Nifty 50 stocks list as prescribed by the exchange.
This keyword will return the current time as HHMM, do not use any special characters

The above condition will be true if the time is 09:20 AM. Time keyword is widely used to control the entry and exits

The above condition can be used in the entry block if you don't want to take new positions after 3:00 PM.

The above condition can be used in universal exit to exit the strategy at 15:15
Please note- Use only integers and not any special characters
Today returns the current day's date in string format. It cannot be equated with any number. The opposite end should also return a string only
Today will return the current date as a string in format YYYY-MM-DD
You can use the Today keyword in a no. of ways, to compare if today is the current week expiry, only trade if today is monthly expiry and so on.

The above condition will be true only if Today is the current week expiry
Similarly, if you want to trade on other days apart from weekly expiry, use the condition below

This keyword returns the next date as a string in format YYYY-MM-DD.
This keyword should not be equated to a number. It should always be compared with keyword that returns a string in same format

The above condition will be true if tomorrow is the current week expiry
This keyword will return a numerical value of the total open interest of an option type at that instant. You can input the underlying instrument and expiry and the option type here. Your request will be processed and a numeric response will be fetched. At the moment it is only available for indices.

The above image shows how to fetch the Total OI for Nifty bank, current month put options.
This keyword returns the True Range(TR) value of the selected Instrument for the selected timeframe. This keyword is to be used under the position keyword

The above keyword will return the previous day TR value of ABFRL
Read here to know more about TR -https://www.macroption.com/true-range/
This keyword can return 5 values pertaining to the Traded instrument ie. (PRICE, QUANTITY, STRIKE, PNL, TIME) .
Traded Instrument keyword is mainly used to retrieve the entry price of instruments traded in the strategy in the condition builder and to retreive the strike price in position builder.
Traded instrument can also fetch the entry time of that particular leg and also individual leg PNL
This keyword can be used in condition builder as well as position builder
.
Example #1

The above are the parameters for Traded Instrument. It will return the price of the instrument traded in leg 1 of set 1 . We can also change the field value to quantity and it will return the quantity of the traded instrument.

The above example will return the Traded/entry price of the instrument traded in leg 1 of set 1

The above example can be used to check SL/T conditions in the condition builder
Example #2

The above parameters will fetch the time of entry/execution of instrument traded in entry leg 1 of set 1
You can use it to compare with a preset time and if condition is true can trigger another set/repair entry

Example #3

The above parameters will fetch the PNL of the leg entered in set 1 of entry, leg 1
This newly introduced parameter makes it much easier to find the PNL of individual legs
The formula used for calculating PNL in Traded instrument keyword is (LTP - Entry Price) * Qty Traded
You can simply use it like the PNL keyword, check below for example

If the PNL of instrument traded in leg 1 of entry set 1 is greater than 500, condition is met.
Note:- This keyword will not work when we select "exit" under Traded Instrument.
How to reference legs?
Set no- Select the set no 1,2,3 etc where the instrument is traded
Condition no- Select condition like 1,2,3 where the instrument is traded, if it is entry leg condition no will always be 1, suppose it is the first repair once then condition no. will be 1 and if traded in the second repair once, condition number will be 2 and so on, suppose it is first repair continuous, condition no will be 1.
Leg 1- Select the leg no. based on the order of the position builder positions. If it is the first leg select 1, if want to reference the 5th leg select 5
Watch this video for an example -https://youtu.be/Ul7q6Rn6ZqM
Watch this video to better understand referencing the legs --https://youtu.be/yHAbw3gGqyc
This keyword as the name suggests returns the Traded instrument name. Traded Instrument name can be selected in many keywords like LTP, EMA, or any indicator to apply that keyword on the traded instrument.

The above are the parameters for Traded Instrument Name. It wil return the name of the instrument traded in leg 1 of set 1 .

When used under LTP keyword it will return the LTP of the instrument traded in leg 1 of set 1
The difference between Traded instrument and Traded instrument name is that Traded instrument Name is usually used under different keywords whereas Traded Instrument can be used as a standalone keyword.
How to reference legs ?
Set no- Select the set no 1,2,3 etc where the instrument is traded
Condition no- Select condition like 1,2,3 where the instrument is traded, if it is entry leg condition no will always be 1, suppose it is the first repair once then condition no. will be 1, if traded in second repair condition number will be 2 and so on, suppose it is first repair continuous, condition no will be 1 and so on
Leg 1- Select the leg no. based on the order of the position builder positions. If it is the first leg select 1, if want to reference the 5th leg select 5
Watch this video for an example -https://youtu.be/Ul7q6Rn6ZqM
Watch this video to learn referencing the legs --https://youtu.be/yHAbw3gGqyc
This keyword returns the total turnover of that instrument at the exchange.


This keyword returns the Triangular Moving Average value of the instrument. This keyword like all technical indicators are to be used under the Position keyword

The above condition is checking if the Previous day (-1) TRIMA value is greater than previous to previous day (-2) TRIMA value of Nifty 50 spot
This keyword returns the Triple Exponential Average Indicator value of the instrument. This keyword like all technical indicators are to be used under the Position keyword

The above condition is checking if the Previous 15 minute (-1) TRIX value is greater than previous to previous 15 minute (-2) TRIX value of HDFC Bank (eq)
The triple exponential average (TRIX) indicator is an oscillator used to identify oversold and overbought markets, and it can also be used as a momentum indicator.
Read more about triple exponential average (TRIX) here - https://www.investopedia.com/articles/technical/02/092402.asp
This keyword returns the value of the indicator called Typical Price. This keyword like all technical indicators are to be used under the Position keyword

The above condition is checking if the LTP of Nifty futures is greater than the previous Typical Price of the Nifty 50 futures day candle (-1)
The Typical Price Indicator (TPI) function measures the average of the high, low, and closing prices for the day using a simple, single-line plot.
Read more about Typical Price Indicator here -https://www.stockmaniacs.net/typical-price-indicator/
This keyword returns the value of the Ultimate Oscillator of the selected Instrument. This keyword is to be used under the position keyword

You can fetch the value of the Ultimate Oscillator on any candle of an instrument, like in the above example, you can fetch the Ultimate Oscillator of previous (-1) 5 min candle of Nifty Bank futures.
Using Tradetron you can now build a strategy level Trailing Stoploss.
Search for keyword "Universal Exit TSL" in your Universal exit condition.

Click on the keyword and select the inputs for TSL type, Activation, Lock profit, Increase profit by and Increase TSL by:


Select your TSL type:
TSL - Points will calculate all values based on rupees in PNL
TSL - Percentage will calculate all values in % of the capital mentioned
This is the start point of your TSL.
Example: If your strategy makes a profit of more than 20 rupees in "activate at", the TSL will begin only when your strategy makes a PNL profit of 20 and above.
This will exit your position if the price moves against you for more than the selected % or points from the activate at level.
Example: If your strategies TSL is activated at 20 rupees if the profit begins to move below 20 rupees, "Lock profit at" will exit at 10 rupees or 10% in profit.
Now add your "Increase profit by"
This is the minimum move in your favor before which the TSL will be modified.
Now add your "Increase TSL by"
The TSL will move by the points or percentage indicated here.
Note: All values in this keyword has to be based on 1X multiplier.
This keyword returns the upper Bollinger value of any period of any series of the selected Instrument. This keyword is to be used under the position keyword

You can plot Upper Bollinger on any series, like close in the above example, you can also plot Upper Bollinger of RSI, OPEN etc
Bollinger Bands are envelopes plotted at a standard deviation level above and below a simple moving average of the price.
Read more about Bollinger Bands here - https://www.fidelity.com/learning-center/trading-investing/technical-analysis/technical-indicator-guide/bollinger-bands
This keyword will fetch the instantaneous value of a particular indicator or series when a crossover happens between two separate indicators. Since we are looking at instruments in series here, this keyword is used as a standalone keyword (not under position keyword).

The keyword shared above will check for a condition when the close crosses above the Supertrend of Nifty 50 on the daily candle. When this crossover happens on the upside, the Tradetron engine will check for the high value of the candle during which the same crossover happened. Since the high value is captured for the signal candle, you can now compare it with any other values using logical operations.

In the example above, we are comparing the LTP with the high of the signal candle to take an entry on the breakout of the same. The same can be done for low, ema, sma etc.

While adding the indicator, you will also see '-n from Last' as a input. This field is used to input which crossover are you referring to. Thus if you need the latest crossover, you can use number '0'. The the crossover before the latest crossover you use number '-1' and so on.
Note: VWAP series keyword won't work in VALUE WHEN. You also need to make sure that you are using the same candle type which checking for conditions using this keyword. This means that you can check for a crossover of the close and supertrend on the 'day' candle and then find out the high/low of the crossover candle. However you cannot check for a crossover of close on '5 mins' candles and the supertrend on 'day' candle.
Vega keyword returns you the vega value of that particular option.

The above example will return the Vega value of the instrument traded in 1st leg of 2nd Repair once of Set 1
This keyword returns the quantity of selected instrument required to make net vega of all positions in the strategy of selected underlying to zero. Returns quantity in multiple of the lot size of Instrument as float
This keyword is usually used in QTY FX in position builder

This keyword returns the Current Volume traded of the selected Instrument for that particular day till the time when the condition is checked. So at any point in time if this keyword is used then it will return total traded volume in that particular instrument up to that instance of time.
Like in the above example you can check whether volume traded for nifty futures is > 1.5 Lakh for the current day. If suppose condition is checked at 2 pm, it will return the total volume traded from 9:15 am till 2:00 pm
This keyword returns the value of the Volume Price Trend of the selected Instrument. This keyword is to be used under the position keyword.

You can plot Volume Price Trend on any candle of an instrument, like in the above example, you can also plot Volume Price Trend of previous (-1) day candle of Nifty Financial Services futures.
This keyword returns the Volume of the selected Instrument for the selected timeframe. This keyword is to be used under the position keyword

The above conditon will return the previous 15min candle Volume of NIFTY 50 current month futures chart.
Please note that, Volume series cannot be used on spot as spot indexes dont have volumes, need to select futures chart
This keyword returns the value of the negative line Vortex Indicator of the of the selected Instrument. This keyword is to be used under the position keyword

You can fetch the Vortex Vi- on any candle of an instrument, like in the above example, you can fetch the Vortex Vi+ line of previous (-1) day candle of Nifty 50 spot
This keyword returns the value of the positive line Vortex Indicator of the of the selected Instrument. This keyword is to be used under the position keyword

You can fetch the Vortex Vi+ on any candle of an instrument, like in the above example, you can fetch the Vortex Vi+ line of previous (-1) day candle of Nifty 50 spot
This is a price action keyword which will calculate the instantaneous VWAP of the instrument under consideration. VWAP needs to be used for an instrument which has volume data. As an example, VWAP for Nifty 50 spot does not exist as the same does not have volume. VWAP need not be used under position keyword.

The keyword shared above will return the VWAP for the current tick of NIFTY futures.

In the example share above, one can check the if the LTP of Nifty 50 futures is greater than the VWAP of the same

In the example share above, one can check the if the LTP of Nifty 50 current week ATM CE is greater than the VWAP of Nifty 50 current week ATM CE
The volume-weighted average price (VWAP) is a trading benchmark used by traders that gives the average price a security has traded at throughout the day, based on both volume and price.
Read about VWAP here - https://www.investopedia.com/terms/v/vwap.asp
This keyword returns the VWAP value of the selected Instrument for the selected timeframe. This keyword is to be used under the position keyword

The above keyword will return the previous 15 min VWAP value of NIFTY 50 Current month Futures
Please note that, VWAP series cannot be used on the spot chart as spot indexes don't have volumes, need to select futures chart
The volume-weighted average price (VWAP) is a trading benchmark used by traders that gives the average price a security has traded at throughout the day, based on both volume and price.
Read about VWAP here - https://www.investopedia.com/terms/v/vwap.asp
This is a price action keyword on volume, meaning areas with higher volume will have a greater weight. On heavy volume days, the VWMA will more closely follow price, and on lower volume days the VWMA will act similarly to a simple moving average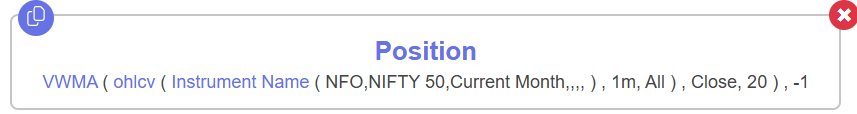
You can plot VWMA on the following series, like close in the above example, you can also plot VWMA of OPEN, HIGH, LOW, CLOSE
Read more about VWMA here - www.patternswizard.com/vwma-indicator/
This keyword returns current week number of the year

The above condition will be satisfied if the current week is the 32nd week of the current year
Week Day returns Day of the week as an integer as 1 for Monday, 2 for Tuesday and so on till 5 as Friday

The above condition will be satisfied if today is Monday
The weekday keyword is very useful for users who want to trade only on particular days of the week. You can create multiple sets such that each set is active only on that particular day

The above condition will be satisfied on all the days except Monday
Number range is from 1- 5
This keyword returns the WIlliams%R indicator value of the selected Instrument for the selected timeframe. This keyword is to be used under the position keyword

The above keyword will return the previous day Williams %R value of ABFRL
Williams %R, also known as the Williams Percent Range, is a type of momentum indicator that moves between 0 and -100 and measures overbought and oversold levels.
Read more about Williams %R here - https://www.investopedia.com/terms/w/williamsr.asp
This keyword returns the weighted moving average of any period of any series of the selected Instrument. This keyword is to be used under the position keyword

You can plot WMA on any series, like close in the above example, you can also plot WMA of RSI, OPEN etc
Weighted moving averages assign a heavier weighting to more current data points since they are more relevant than data points in the distant past.
Read more about WMA here - https://www.fidelity.com/learning-center/trading-investing/technical-analysis/technical-indicator-guide/wma
This keyword returns the current year

Year day returns the current day number from the beginning of the year as an integer

The above condition will be satisfied if today is the 205th day of the year
This keyword returns the Zero Lag EMA of any period of any series of the selected Instrument. This keyword is to be used under the position keyword

You can plot the Zero Lag EMA on any series, like close in the above example, you can also plot EMA of RSI, OPEN etc
This keyword will return the Zscore of the selected series of the particular instrument.
Zscore is generally used under the position keyword
This keyword has 2 inputs, one is to select the series, other is to select the period which is the no. of previous values to consider or the sample

The above condition will return the Zscore of the NIFTY 50 close series, considering the sample data of the past 20 candles
Zscore keyword used in Tradetron is part of SCIPY library -https://docs.scipy.org/doc/scipy/reference/generated/scipy.stats.zscore.html
Pricing, brokers, strategies — anything.


