





Know if your edge is real — before you risk a rupee.
Nobody can predict the market. But you can find out whether a strategy has an edge — by replaying it against years of real, minute-by-minute history. Tradetron does that in a few clicks, then hands you an interactive report graded A–F, net of every cost. History doesn't repeat, but it rhymes.
Trading without an edge is just an expensive way to gamble.
The future is genuinely unpredictable — no backtest changes that. What a backtest does change is whether you're guessing. It answers the one question that separates a strategy from a hunch: over hundreds of past days, did this set of rules actually make money after costs — or did it only look good on a lucky week?
Prices never repeat exactly, but conditions recur — trends, mean-reversion, volatility crushes, gap-ups. A rule that profited across many of those regimes is far likelier to hold than one you've only imagined.
A single good month proves nothing. A backtest exposes concentration, drawdowns and win-rate across the whole window — and a Monte-Carlo pass reshuffles your returns 2,000 times to ask: was this edge, or luck?
Brokerage, slippage, STT, GST and stamp duty quietly eat returns. Gross P&L flatters everyone. Every Tradetron backtest is scored on net P&L — so a strategy that only wins before costs can't hide.
From My Strategies to a graded report in minutes.
Any template you build — with Claude, the Advanced Builder, or the wizards — is one click from a backtest. No exports, no spreadsheets, no code.
Open My Strategies, find your strategy, and press the Backtest button on its row — same rules you'd deploy live.
Choose a date range and capital, and set your cost profile once — brokerage, slippage and statutory charges for your broker and segment.
Every leg is filled at the actual traded price for each minute of the window — real option premiums and OI, not a model.
In minutes you get an interactive, graded report — grade, stats, equity curve, drawdowns, Monte-Carlo and a live cost lab.
Most backtesters take a shortcut. Tradetron lives through every minute.
Most fast backtesters are vectorised: they run your signal across the whole price history in one big array sweep. It's quick — and it's stateless. It has no idea what your running P&L is, which legs are still open, or what you decided three bars ago. Tradetron can't work that way, because your strategy's own state drives its next decision.
- Compute signals over the whole series at once — no memory of what happened between bars.
- Can't model a decision that depends on live P&L — "exit everything if the strategy is down ₹X".
- Trailing stops, re-entries, per-leg repair, dynamic sizing and set/leg state get faked or dropped.
- The result is a mathematical approximation — not what your rules would actually have done.
- Walks every data point in order, carrying full state — positions, P&L, runtime variables, counters, set & leg status.
- Every condition is evaluated against that live state, exactly as the deploy-time engine would.
- Path-dependent logic — trailing SL, re-entries, hedge repair, P&L-based exits — runs for real, not approximated.
- What you backtest is byte-for-byte what you would have traded.
Because each decision feeds back into your strategy's own state, there is no shortcut and no array trick that gets it right. The only honest way is to step through history one data point at a time — the same engine, the same order of events, the same rules:
A backtest is only as honest as its data.
Tradetron replays real historical prices — minute-resolution OHLC and open interest, including actual option premiums — not a Black-Scholes approximation. Here's what's loaded today, all at 1-minute resolution.
| Market | Granularity | History available | Depth |
|---|---|---|---|
| NSE Index & cash spot18,713 instruments · ~730 M bars | 1-minute OHLC | Jan 2020 → today | 6+ yrs |
| NFO NSE F&O — index & single-stock derivatives536,895 instruments · ~820 M bars | 1-minute OHLC + OI | Index F&O Jan 2020 · stock futures 2021 → | 6+ yrs |
| MCX Commodities — crude, gold, silver, natgas…13,616 instruments · ~54 M bars | 1-minute OHLC + OI | 2020, 2021, 2023, 2024 · 2022 backfilling | 4 yrs |
| BSE Sensex & Bankex F&O26,798 instruments · ~30 M bars | 1-minute OHLC + OI | 2025 → today | 1.5 yrs |
| Crypto Delta India — crypto futures & optionsfull option chain · counts confirming | 1-minute OHLC | ≈ 2021 → today | ~5 yrs |
● Across markets: 596,000+ instruments and ~1.6 billion 1-minute bars — every real print, deepening every day. NSE, NFO and Delta-India crypto backtest today; MCX and BSE history is being expanded.
Cash equities & stock F&O, end-of-day. The full NSE stock universe and single-stock derivatives from the official NSE Bhavcopy — daily bars, corporate-action adjusted (splits, bonuses, dividends) so multi-year equity backtests stay clean and survivorship-honest. Targeting 2026; timing subject to change.
One report that a fund analyst would recognise.
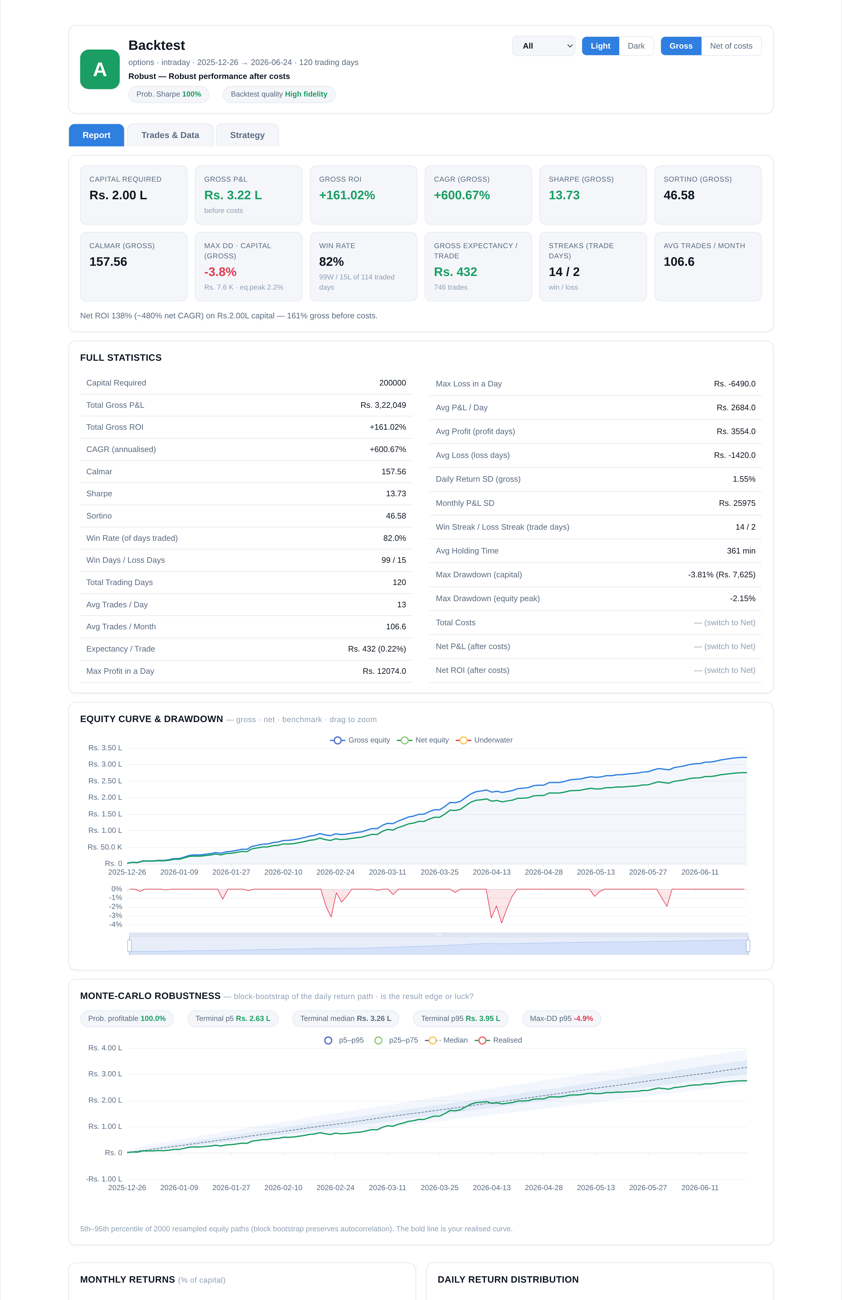
Not a PDF of numbers — a live, interactive document you can interrogate. Switch the period, toggle gross vs. net, drag the cost sliders, drill into every round-trip.
- ◆The grade, up topAn A–F medallion and a one-line verdict — the whole strategy's health in a glance, before you read a single chart.
- ◆Change the period on the flyA dropdown re-slices everything to the last 1M / 3M / 6M / 12M or the full window — stats, charts and grade recompute instantly.
- ◆Gross ↔ net, one toggleFlip between headline gross P&L and the number that actually lands in your account after every charge.
- ◆Monte-Carlo: edge or luck?2,000 bootstrapped equity paths give a probability-of-profit and a realistic best/worst cone around your result.
- ◆Every statistic that mattersCAGR, Sharpe, Sortino, Calmar, expectancy, win/loss streaks, drawdown depth & days underwater, trade-by-trade MAE/MFE.
Why a single letter is worth a thousand rows.
A stats table can bury a fatal flaw in row 30. Tradetron's grading rubric distils the whole backtest into one honest verdict — scored on net-of-cost performance — and it's fully transparent: you can audit exactly why a strategy earned its letter. No black box, no cherry-picking the gross number.
The score starts at 100 and is docked against four things that quietly wreck real accounts:
The worst peak-to-trough fall on your capital. A 20% max drawdown costs a little; a 50%+ drawdown — the kind that makes you switch the strategy off at the worst moment — costs a lot.
How much of the profit came from a single month. The penalty starts once one month carries roughly 35% of the result and climbs toward 100% — because a strategy resting on one month is really one lucky event, not an edge.
The share of days (and months) in the green. A strategy that loses on most days needs enormous winners to survive — that fragility shows up here.
Risk-adjusted return after costs. A sub-1 net Sharpe is mediocre for an algo and moves the grade hard; 2+ is genuinely strong. Reward without the risk to earn it doesn't count.
Below the grade, the report lists the risk flags that fired and a short set of hypotheses to test — "a 90-day drawdown suggests no portfolio stop-loss; add a max-loss kill-switch and re-run" — turning a verdict into your next experiment.
Watch costs eat your edge — in real time.
This is the thing a static PDF can never do. Drag any cost assumption and the whole report — net P&L, ROI, net Sharpe, the grade — recomputes on the spot. Try it right here (illustrative; the live report runs it on your actual fills):
Illustrative sample, chosen to show the report format — a deliberately strong result, not typical and not a return to expect. Intraday options · ₹2.00 L capital · ~746 legs · ₹4.0 Cr turnover.
A faithful replay — not a time machine.
Tradetron reproduces your logic exactly, but a backtest can only replay what history recorded. A few things genuinely can't be reconstructed — know them, and your expectations stay honest.
Your margin, funds and equity live inside your broker in real time — there's no historical copy to replay, and a backtest doesn't model real SPAN/ELM margin.
- Available margin
- Account equity
- Capital deployed
Data that arrives live from an outside source has no stored past, so it can't be reconstructed for a historical run.
- Sentiment / news score
- StockGPT analysis
- Live FX rates (USD-INR…)
- External API / webhook data
Minute candles carry no bid/ask spread and no intra-minute sequence, so anything that hinges on tick-level timing or the exact spread can't be reproduced.
- Bid / ask price
- The
Sec(sub-minute) keyword - Latency-dependent fills
Strategies that trade on external API or webhook signals can't be backtested. If your strategy fires on alerts pushed from TradingView, a custom webhook, or a third-party API, those past signals were never recorded — there is nothing to replay. Validate those in paper trading instead.
The engine replays 1-minute bars, not every tick. Inside a minute the exact path of price is invisible, so a stop-loss, target or entry is filled at the minute's price — not the precise instant it would have triggered live. Treat fills as faithful approximations, not tick-perfect: real slippage, partial fills and fast intra-minute spikes can differ. That's exactly why the honest path is always Backtest → Paper → Live.
Priced to run, not to ration.
Backtesting runs on credits you top up from the Backtest page. No subscription, no lock-in — buy what you'll use.
- Full interactive report with the grade, stats, charts, Monte-Carlo and cost lab
- Buy credits in seconds from the Backtest page — paid out of your wallet balance
- A failed or errored run is refunded — you're only charged for a completed backtest
- Detailed reports stay live for 3 days, then archive to a summary you keep
Testing a Nifty weekly straddle over the last 3 years?
→ 3 years = 6 six-month blocks × 1 underlying
→ 6 credits = ₹120 for the full run.
Want to compare it on Bank Nifty too?
→ another 6 credits = ₹120.
A morning's worth of rigorous testing for the price of a coffee — and you'll know whether the edge is real before you deploy a single lot.
Before you run your first one.
If the future is unpredictable, what's the point of a backtest?
How realistic are the fills — is this a simulation or real prices?
Can every strategy be backtested?
Does it account for brokerage, slippage and taxes?
Which markets and how far back can I test?
How much does it cost?
Find your edge before the market finds your account.
A strategy you built this morning can be graded against six years of history by lunch.
Risk disclosure. Backtested and simulated results are hypothetical, are generated with the benefit of hindsight, do not represent actual trading, and are not indicative of future results. Any figures on this page — including the sample report and the cost-lab numbers — are illustrative examples of the report format, not a forecast, recommendation, or promise of returns. Trading in securities and derivatives carries a substantial risk of loss and is not suitable for every investor. Historical-data coverage and market availability are being expanded and may change.