

When a backtest finishes, the report is emailed to you. You can also download a Stats PDF and a Positions CSV from the Backtest page.
Download it within 3 days. After that, the run is archived (Backtest page → Archived tab).
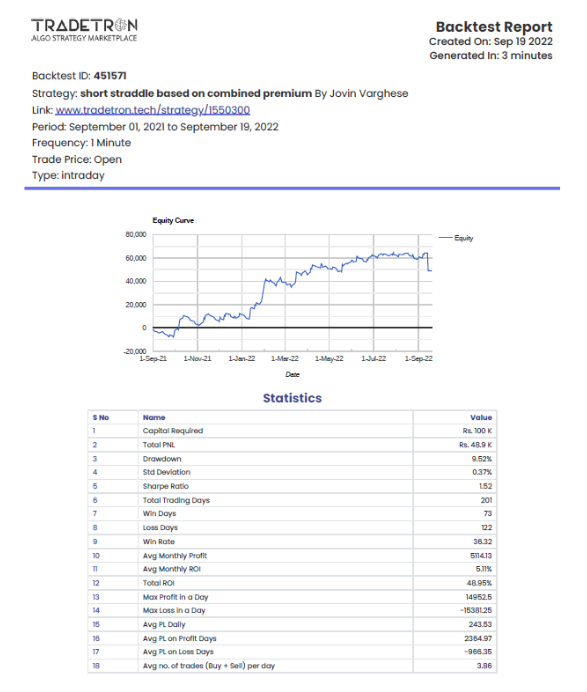
Main numbers
- PNL curve – how profit and loss moved over the period.
- Capital Required – the starting capital. All ROI figures use this as the base.
- Total PNL – total profit or loss for the whole period.
Risk
- Drawdown – the % fall from the highest point of the PNL curve to the lowest point after it.
- Standard Deviation – volatility, in %. Lower means steadier.
- Sharpe Ratio – return adjusted for volatility. Higher is better. The annualised Sharpe uses a risk-free rate of 0.
Consistency
- Total Trading Days – trading sessions in the period.
- Win Days / Loss Days – number of profitable and losing days.
- Win Rate – profitable days ÷ total trading days.
- Avg Monthly Profit and Avg Monthly ROI – average per month.
- Total ROI – return for the whole period.
- Max Profit in a Day / Max Loss in a Day – best and worst single day.
- Avg PL Daily – total PNL ÷ total trading days.
- Avg Profit on Profit Days / Avg Loss on Loss Days.
- Avg no. of trades (Buy + Sell) per day – total trades ÷ trading sessions.
- Month-wise PNL – profit or loss for each month.
Positions CSV
Every position the backtest took, with the condition, price and quantity.
No single number tells you a strategy is good. Read Sharpe, Drawdown and Win Rate together. Backtest results are not a promise of future results.
 Edited with AI from the original Tradetron article, checked against current docs (Oct 2026). Spot something wrong? Tell us in the Community.