

- Click Strategies and select Deployed.
- On the strategy card, click the three dots (⋮).
- Choose Statistics. It opens a full report: equity curve, day-wise equity, win rate, Sharpe and Sortino, max drawdown, a weekday summary and month-wise P&L. You can print it.
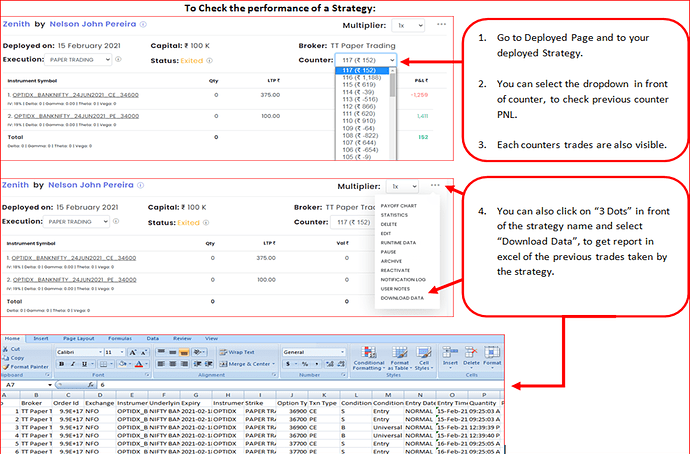
Other useful options:
- The Counter dropdown on the card shows the P&L of each run, plus an All total.
- Intraday PNL in the same ⋮ menu shows how P&L moved during the day.
- For trade data, use Download Data in the ⋮ menu (on your own deployments).
 Edited with AI from the original Tradetron article, checked against current docs (Oct 2026). Spot something wrong? Tell us in the Community.