Demystifying the Sharpe Ratio: A Simple Guide to Measuring Investment Risk and Reward
When it comes to making sound investment decisions, understanding risk and return is crucial. The Sharpe Ratio is a valuable tool that helps investors assess the performance of their investments in a way that takes both risk and return into account. In this article, we will demystify the Sharpe Ratio and explain it in simple terms, making it accessible to everyone.
What is the Sharpe Ratio?
The Sharpe Ratio, named after its creator, Nobel laureate William F. Sharpe, is a metric that evaluates the risk-adjusted return of an investment. In simpler terms, it helps us determine if an investment's returns are worth the level of risk taken to achieve them.
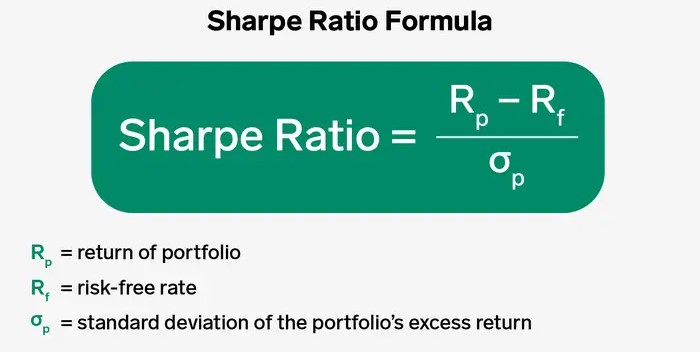
To calculate the Sharpe Ratio, you need three key pieces of information:
The average annual return of the investment.
The risk-free rate of return (usually the yield on a government bond).
The investment's standard deviation (a measure of its volatility or risk).
Let's break down these components and see how they come together to create the Sharpe Ratio.
Average Annual Return
The average annual return is simply the average gain or loss an investment makes in a year. For example, if you invest ₹ 10000 in a stock that grows to ₹12000 in a year, your average annual return would be 20%.
Risk-Free Rate of Return
The risk-free rate represents the return you could earn with no risk at all, typically by investing in government bonds or Fixed Deposits. It acts as a benchmark for assessing the extra return you should receive for taking on additional risk in other investments. If the risk-free rate is 4%, for instance, this is the return you could expect without any risk.
Standard Deviation
Standard deviation measures how much an investment's returns fluctuate over time. Higher standard deviation indicates greater volatility and, therefore, higher risk. Lower standard deviation suggests more stable returns and lower risk.
Calculating the Sharpe Ratio
Now that we have these components, we can calculate the Sharpe Ratio using the following formula:

Let's consider a practical example:
Average Annual Return: 10%
Risk-Free Rate: 3%
Standard Deviation: 15%
Using the formula, the Sharpe Ratio would be:
Sharpe Ratio:- 10 - 3 / 15 = 0.47
Interpreting the Sharpe Ratio
The resulting Sharpe Ratio is a single number that tells us how well an investment has performed relative to the level of risk it carried. In our example, a Sharpe Ratio of 0.47 indicates that for each unit of risk, the investment generated 0.47 units of return above the risk-free rate.
Here's a simple way to interpret the Sharpe Ratio:
A higher Sharpe Ratio suggests a better risk-adjusted return.
A Sharpe Ratio of 1 or higher is generally considered good.
A negative Sharpe Ratio indicates that the investment did not compensate you for the risk taken.
Comparing Investments
One of the great advantages of the Sharpe Ratio is its ability to help you compare different investments or strategies. Let's say you're considering two investment options: Strategy A and Strategy B.
Strategy A has an average annual return of 12%, a risk-free rate of 3%, and a standard deviation of 20%, resulting in a Sharpe Ratio of 0.45.
Strategy B has an average annual return of 8%, a risk-free rate of 3%, and a standard deviation of 10%, resulting in a Sharpe Ratio of 0.50.
In this case, Strategy B has a higher Sharpe Ratio, indicating that it provides a better risk-adjusted return compared to Strategy A. So, all else being equal, Strategy B might be the preferable choice.
In the world of investing and trading, the Sharpe ratio stands as a vital metric to assess the historical performance of investments and strategies. It provides a quantitative measure of the risk-adjusted return, which is crucial for making informed decisions.
For those who wish to put their investment strategies to the test, Tradetron offers a powerful tool – Backtest Engine v2. This tool empowers users to create, customize, and test their own trading strategies. Whether you're an experienced trader looking to fine-tune your approach or a newcomer hoping to gain insights, Tradetron's Backtest Engine v2 is a valuable resource.
For more in-depth information and to explore the possibilities, you can visit the following link: https://tradetron.tech/blog/backtest/
It's a significant step toward enhancing your trading acumen and making well-informed trading choices.


 Made with Superblog