Contents
What are Bollinger Bands?
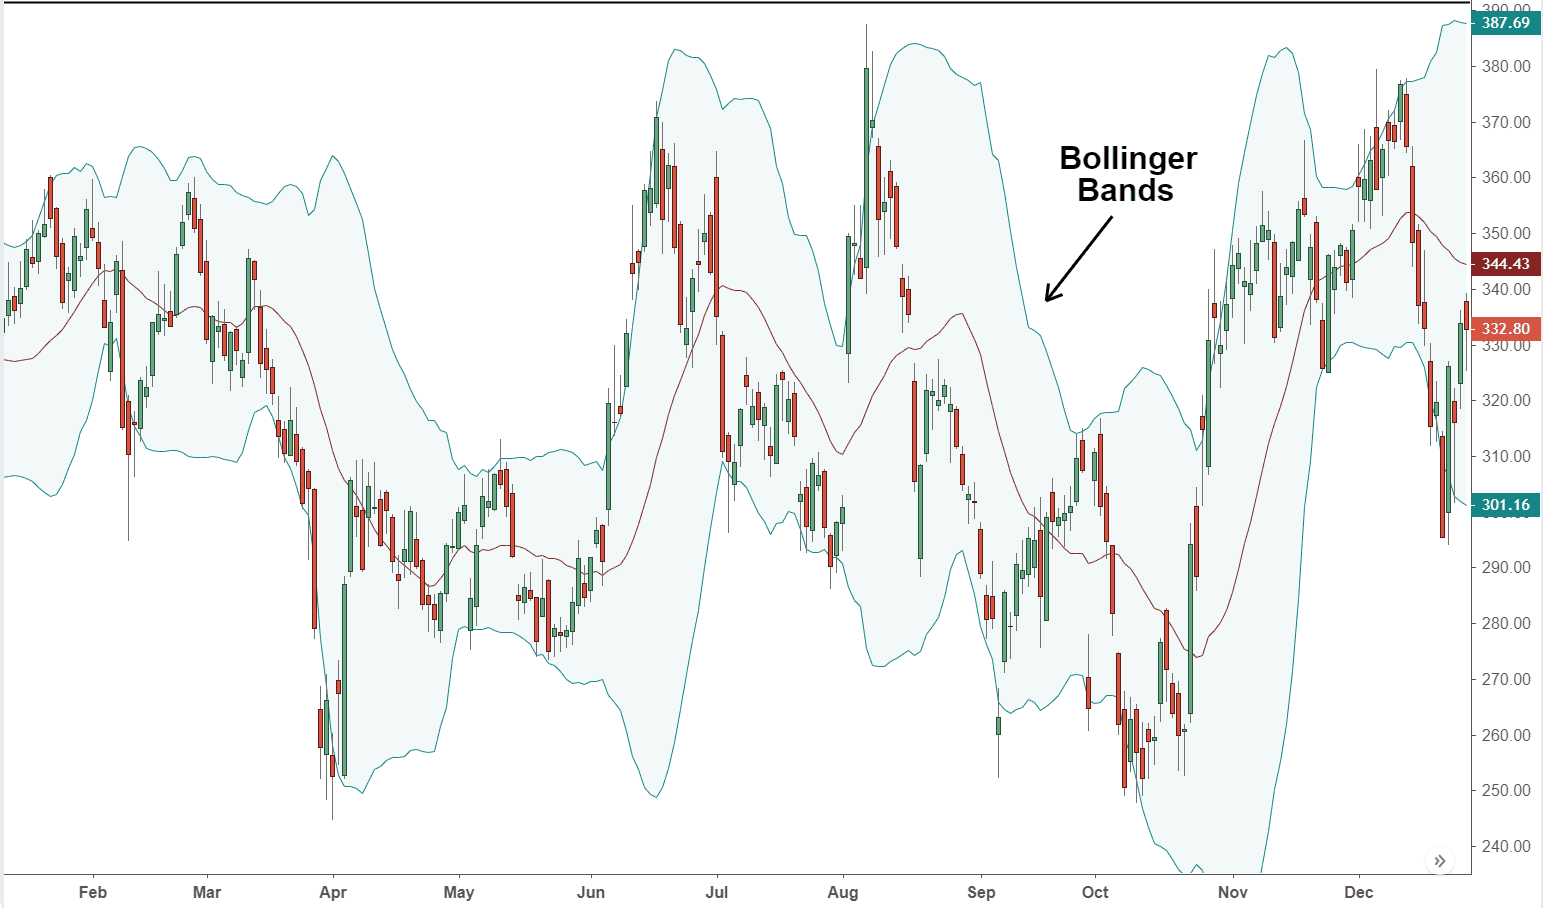
Bollinger Bands are a technical analysis tool used to measure the volatility of an asset's price movements.
They consist of three lines: a simple moving average (SMA) in the middle, and two standard deviations plotted above and below it.
The SMA represents the trend line while the upper and lower bands represent resistance and support levels respectively.
The width between the upper and lower bands is determined by market volatility, with wider bands indicating higher volatility levels.
When prices move outside of these bands, traders often interpret this as a signal that an asset is either overbought or oversold.
This can be useful for identifying potential entry or exit points in trading strategies.
Bollinger Bands provide traders with valuable insights into market conditions beyond what basic charts may offer.
Traders can use them to help identify key trends, price reversals, breakouts, and other important signals that could impact their overall strategy.
Bollinger Bands Trading Strategy
Bollinger Bands is a popular trading strategy tool used by many traders to identify potential buy and sell signals.
The strategy involves using volatility bands placed above and below the price chart to determine when an asset is overbought or oversold.
To buy low with Bollinger Bands, look for times when the price of an asset falls towards the lower band.
This indicates that the asset is potentially oversold, meaning it may be undervalued and due for a bounce back up in price.
Once you have identified this signal, consider purchasing the asset at its current value.
To sell high with Bollinger Bands, keep an eye out for instances where prices rise towards or beyond the upper band.
This suggests that an asset may be overvalued and could see a downward trend soon after.
In this scenario, it might be wise to sell off some or all of your holdings at current market rates before any significant decline occurs.
It's essential to note that while these signals can be useful tools in making trades, they are not always accurate indicators of future market movements.
As such, it's important to use other analytical methods alongside Bollinger Bands when evaluating investment options thoroughly.
Now with the concepts covered, let us create our first Bollinger Bands Strategy on Tradetron.
We will be using one technical indicator (Bollinger bands).
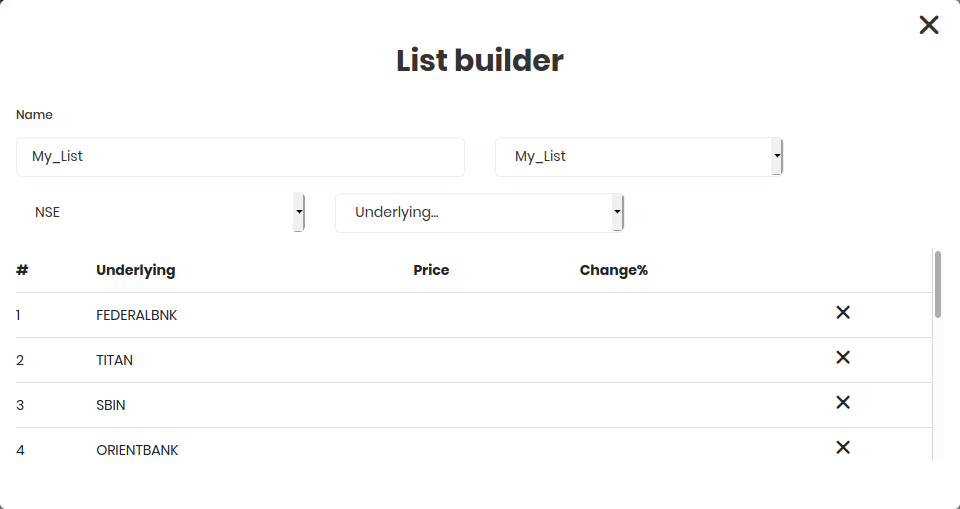
Our custom list of instruments:
The candle size we use in this strategy is of 15 minutes
Entry:
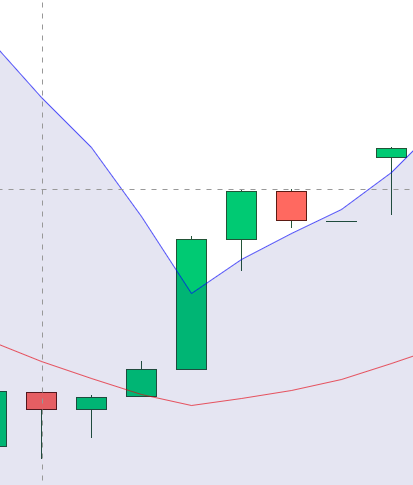
Set 1 [Long Side]: Buy 100 shares when
- Previous to previous candle is Green
- Previous to previous candle Close higher than upper bollinger band
- Previous to previous candle Open higher than upper bollinger band
- Previous candle is a Green candle
- previou candle Open is higher than upper bollinger band
At any given time, we can grab the previous to previous candle by position -2 and previous candle by position -1.
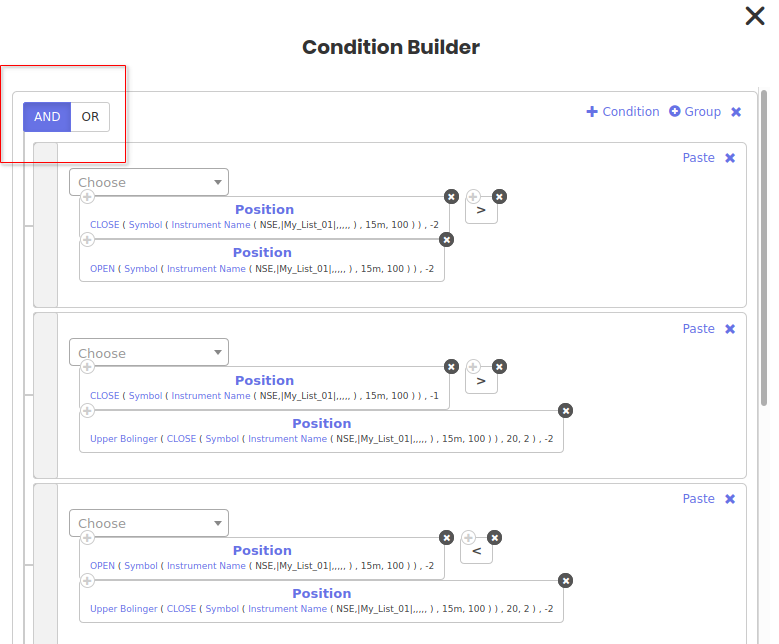
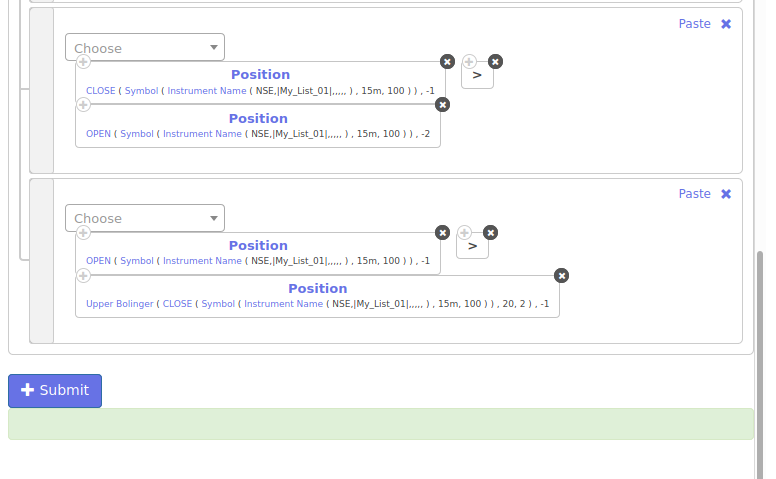
All the above conditions are connected with each other by a Logical AND as we want all of them to be true before taking a position.
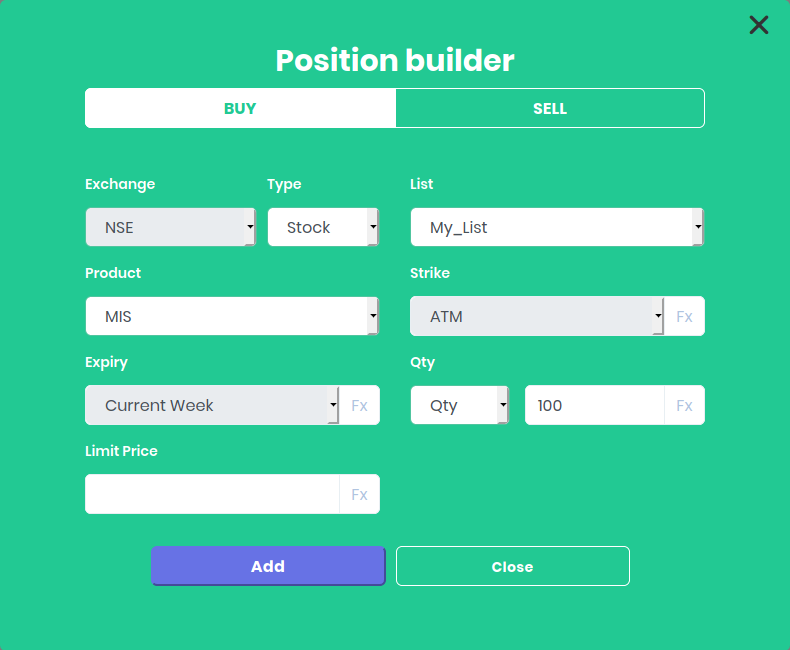
Position
Buy/Long 100 shares when the conditions are true
List of Instruments
- FEDRALBANK(NSE)
- TITAN(NSE)
- SBIN(NSE)
- ORIENTBANK(NSE)
- UNIONBANK(NSE)
- ALBK(NSE)
- POWERGRID(NSE)
- RELIANCE(NSE)
- AXISBANK(NSE)
- HINDUUNILVR(NSE)
- TATAMOTORS(NSE)
When you select your custom list, the position builder automatically picks it up.
Mention the quantity as 100 and click the ADD
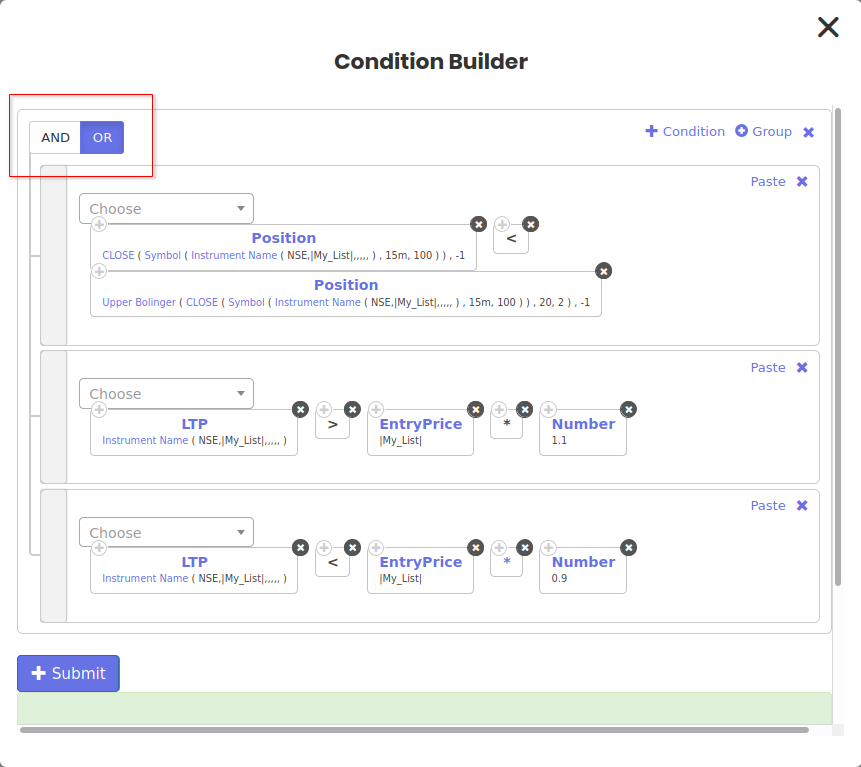
Exit
The entered position will be exited, when either:
- Previous candle close goes below upper bollinger band
- OR Hit a stop-loss of 10%
- OR Hit a Target profit of 10%
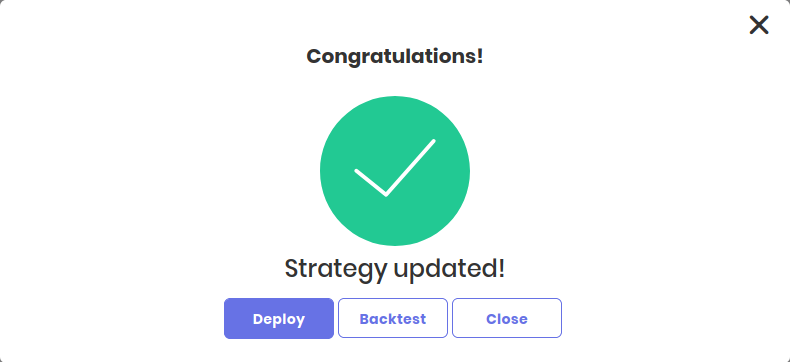
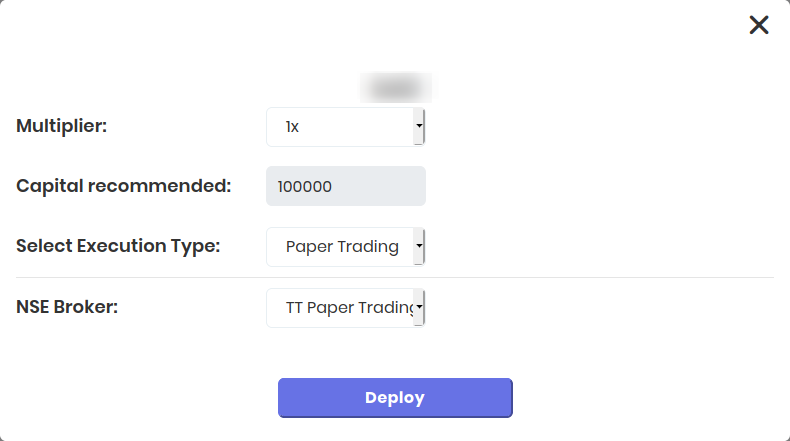
All that is left to do is click Create and click Deploy, Select Paper Trading and you are done

Frequently Asked Questions On Bollinger Bands
1. What is the best Bollinger Bands strategy?
The best Bollinger Bands strategy is one that combines technical analysis with risk management.
The Bollinger Bands are a popular technical indicator used to identify potential price trends and volatility in the market.
One effective strategy is to use the Bollinger Bands as a tool for identifying overbought or oversold conditions.
When prices move outside of the upper or lower bands, it can indicate an opportunity for a reversal in trend.
However, relying solely on this signal can be risky as false signals may occur.
Therefore, it's important to combine this approach with other indicators such as RSI (Relative Strength Index) and MACD (Moving Average Convergence Divergence).
To manage risk effectively, traders should also use stop-loss orders to limit potential losses and take-profit orders to lock-in profits when entering trades based on Bollinger Bands signals.
2. What is the best time frame for Bollinger Bands?
The best time frame for Bollinger Bands largely depends on the trader's individual trading style and goals.
However, there are a few general guidelines that can be followed.
For short-term traders who focus on day trading or scalping, using a shorter time frame such as 5-minute or 15-minute charts may be ideal.
This allows for more frequent trades with tighter stop-loss levels and faster profit targets.
For swing traders who hold positions for several days to weeks, using a longer time frame such as daily or weekly charts may provide better insights into overall trends and market movements.
It is important to note that regardless of the chosen time frame, Bollinger Bands should always be used in conjunction with other technical indicators and fundamental analysis to confirm trade signals and mitigate risk.
3. What is the formula for the Bollinger Bands?
The Bollinger Bands are a technical analysis tool used to measure volatility and identify potential price movements in financial markets.
The formula for calculating the Bollinger Bands is relatively simple and involves three main components: a moving average, an upper band, and a lower band.
Bollinger Percentage Formula:
Bollinger %b = (Closing Price - Lower Band) / (Upper Band - Lower Band)
Alternatively, First, calculate the moving average of a given security or asset over a specified period of time, typically 20 days.
This moving average serves as the center line for the Bollinger Bands.
Next, calculate two standard deviations above and below the moving average to create the upper and lower bands respectively.
These bands represent levels where prices are statistically likely to revert back towards the mean or move beyond it.
To summarize:
- Calculate a 20-day moving average
- Calculate two standard deviations above and below this moving average
- Plot these values on a chart to form upper and lower bands around the moving average
4. Is Bollinger Bands a good indicator?
Bollinger Bands can be a helpful indicator for traders who are looking for insights into market volatility and potential price movements.
These bands are derived from simple moving averages and use statistical analysis to plot two standard deviations above and below the average, creating a channel that represents the current trading range.
5. Which indicator is best for trading?
Most commonly used indicators include moving averages, Bollinger Bands, relative strength index (RSI), and MACD.
It is recommended to thoroughly research and understand each indicator before incorporating them into your trading strategy.
Ultimately, the best indicator for trading will depend on your individual goals and risk tolerance level.
6. What does bollinger band indicate?
The Bollinger Bands are a popular technical analysis tool that provides valuable insights into the price volatility and potential reversals in financial markets.
Developed by John Bollinger, these bands consist of three lines plotted on a price chart.
The middle line represents the 20-day simple moving average (SMA), acting as the baseline for the indicator.
The upper band is created by adding two standard deviations to the SMA, while the lower band is derived by subtracting two standard deviations from it.
Now, what does this all mean?
Primarily, Bollinger Bands indicate volatility. When prices are experiencing high volatility, these bands will widen as market fluctuations increase.
Conversely, during periods of low volatility or consolidation phases, they narrow down.
Bollinger Bands provide crucial information about both current market conditions and potential future price movements based on historical data analysis.
With their ability to visualize volatility levels and predict trend reversals effectively if used correctly; they have become an indispensable tool for many traders across various financial markets worldwide.
7. How to trade using bollinger bands?
Trading using Bollinger Bands can be a powerful tool for identifying potential trading opportunities in the financial markets.
Here's a creative, detailed, and concise approach to utilizing this indicator effectively:
1. Understanding Bollinger Bands:
Bollinger Bands consist of three lines plotted on a price chart: the middle band (typically a 20-period moving average), an upper band (usually two standard deviations above the middle band), and a lower band (two standard deviations below).
These bands dynamically expand or contract based on market volatility.
2. Identifying Squeeze Patterns:
A squeeze occurs when the distance between the upper and lower bands narrows significantly, signifying low market volatility. This suggests that a breakout is imminent.
To identify squeeze patterns, monitor periods where Bollinger Band width reaches relatively low levels.
3. Wait for Volatility Expansion:
Once you spot a squeeze pattern, patiently wait for price action to break out of the Bollinger Bands' confines before entering any trades.
A breakout above the upper band indicates bullish sentiment, while one below the lower band implies bearishness.
4. Confirm with Other Indicators:
While Bollinger Bands provide valuable insights into market volatility and potential breakouts/breakdowns, it is always wise to complement their signals with other technical indicators or fundamental analysis tools like trendlines, support/resistance levels, oscillators (e.g., RSI), or candlestick patterns before executing your trade.
5. Define Your Entry and Exit Points:
Based on confirmed signals from multiple indicators mentioned above, decide where to enter your trade by setting specific entry points either slightly above/below recent highs/lows or at key technical levels such as support/resistance zones.
6. Set Stop-Loss Orders & Implement Risk Management:
To protect against adverse price movements, set stop-loss orders just beyond significant support/resistance areas or according to your predetermined risk management strategy - typically around 1-2% of your trading capital. This helps limit potential losses and protect your investment.
7. Employ Trailing Stops and Take-Profit Levels:
Consider using trailing stops to lock in profits as the price moves favorably, allowing you to ride the trend while protecting against sudden reversals.
Additionally, set realistic take-profit levels based on technical analysis or predetermined risk-reward ratios to secure gains when market conditions are favorable.
8. Regularly Review and Adapt Your Strategy:
Continuously analyze your trades, reviewing both successful and unsuccessful ones.
Adjust your strategy as needed by incorporating new insights gained from experience, such as modifying indicators' parameters or adapting to different market conditions.
For any queries, please write to us at [email protected]


 Made with Superblog