Renko Charts: Automate Your Renko Strategies To Enhance Trading Efficiency With Tradetron
Introduction to Renko Charts
Renko charts are a unique type of charting technique that originated in Japan.
They focus on price movements rather than time, and help traders identify trends more easily by eliminating the noise caused by small price fluctuations.
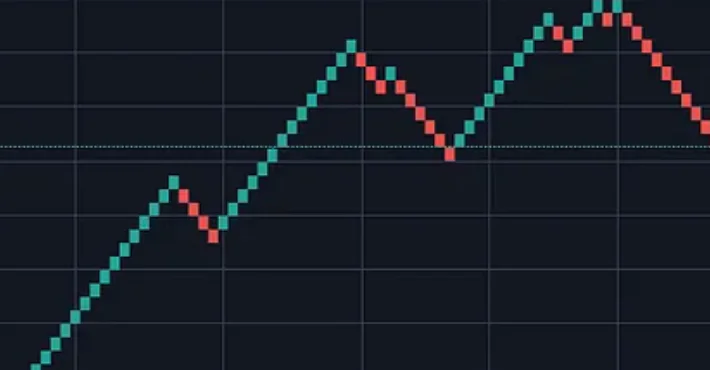
The Renko chart consists of bricks or boxes that represent fixed price movements, instead of being based on time intervals.
The brick size can be customized according to the trader’s preference and risk tolerance levels.
When prices move beyond the chosen brick size, new bricks form either above or below the previous one depending on whether it was an upward or downward movement.
When it comes to technical analysis in financial markets, traders are constantly on the lookout for effective tools that can provide valuable insights and improve decision-making.
Renko charts are one such tool that has gained popularity among traders for its unique approach to visualizing price movements.
In this blog, we will explore the concept of Renko charts, compare them to traditional candlestick and Heikin-Ashi charts, and also discuss, how you can automate your Renko-based strategies using Tradetron, a revolutionary platform in India.
Building Renko-Based Strategies
With Tradetron, you can easily translate your Renko-based trading strategy into an automated system.
The platform offers a range of pre-built blocks and indicators specifically designed for Renko charts.
These blocks can be combined and customized to create your unique trading logic and rules.
In our latest video on Youtube we have explained how you can automate your Renko strategy without any coding knowledge.
You can even duplicate this renko demo strategy for free of cost.
What is Renko chart technique?
Renko chart technique is a type of technical analysis that emphasizes price movement rather than time.
It is named after the Japanese word "ren" meaning brick and "ko" meaning small or minute, as it uses bricks to represent price movements in a way that filters out minor fluctuations.
Each Renko brick represents a fixed price range, which can be determined by the trader based on their preferences and market conditions.
When prices exceed this range, a new brick is added either above or below the previous one depending on whether the trend is bullish or bearish.
The benefits of using Renko charts include clear identification of trends and support/resistance levels, reduced noise from insignificant price movements, and improved visualization of key trading signals such as breakouts and reversals.
Renko charts, derived from the Japanese word "renga" meaning brick, offer unique features that set them apart from traditional candlestick charts.
Pros and Cons Of Renko Charts
Here are the key Pros and Cons of Renko charts:
1. Continuous Visualization
Renko charts operate continuously, disregarding time intervals, allowing traders to observe price trends without time-related interruptions.
2. Trend Reversal Indicators
Renko charts detect trend reversals when the price moves twice the brick size in the opposite direction, helping filter out false signals.
3. Concurrent Opening Prices
During trend reversals, the opening price of a brick aligns with the subsequent brick, ensuring accuracy in depicting price movements.
4. Limited Trend Angle Information
The trend angle in Renko charts depends on the brick width and doesn't provide additional information.
5. Incomplete High/Low Capture
Renko charts may not capture exact highs and lows if the price fails to surpass the brick size before reversing.
6. Timestamps Reflect Brick Moments
Renko charts display bricks at the moment they are drawn, representing significant price movements compared to the previous close.
7. Multiple Bricks with the Same Timestamp
Renko charts show consecutive bricks with the same timestamp during substantial price movements, contributing to long trend lines. However, not all trend lines may be tradable.
8. Variable Chart Width
Renko chart width varies based on brick size, market volatility, and net price movement, making direct comparisons with time-dependent charts challenging.
9. Capturing Movements Greater than the Brick Size
Renko charts excel at capturing price movements larger than the brick size, providing valuable insights for traders.
These features make Renko charts a powerful tool for visualizing price trends and identifying potential trading opportunities.
Differences between Renko, Candlestick, and Heikin-Ashi Charts
1. Time vs. Price
The most significant difference between Renko charts and traditional candlestick charts is the representation of time.
While candlestick charts are based on time intervals (e.g., 1 minute, 5 minutes), Renko charts focus solely on price movements, ignoring time altogether.
This can provide a clearer picture of price trends and eliminate noise caused by volatile price fluctuations.
2. Smoother Trends
Renko charts are known for their ability to filter out market noise, resulting in smoother trends.
Traditional candlestick charts can sometimes create false signals due to small price fluctuations within a given time interval.
Renko charts, on the other hand, highlight significant price movements, making it easier to identify trends and reversals.
3. Brick Size vs. Candlestick Colors
Renko charts use bricks of fixed size to represent price movements, while candlestick charts use different colors (typically green for bullish and red for bearish) to represent price direction.
Renko charts provide a more standardized visual representation of price movements, focusing solely on the magnitude of the movement rather than the duration.

4- Heikin-Ashi as a Middle Ground
Heikin-Ashi charts are a hybrid between traditional candlestick and Renko charts.
They use a modified calculation for candlestick open, close, high, and low prices, resulting in smoothed candlestick patterns.
Heikin-Ashi charts can provide a compromise between the detailed information of candlestick charts and the filtered trends of Renko charts.
Conclusions
Automating your Renko-based strategies with Tradetron opens up a world of possibilities in the realm of algorithmic trading.
By leveraging the power of automation, you can eliminate human error, reduce emotional decision-making, and take advantage of market opportunities with speed and precision.
Whether you're a seasoned trader or a beginner, Tradetron provides a user-friendly platform to bring your Renko-based strategies to life.
Start exploring the automation revolution and unlock the potential for consistent profitability in your trading endeavors.
To complement this discussion on automating Renko-based strategies, we recommend watching a thought-provoking video titled "Unleashing the Power of Renko Charts."
In the above video, you'll gain a comprehensive understanding of Renko charts based keywords of Tradetron.
It provides step-by-step guidance on constructing demo Renko strategy, highlights their key features, demonstrates practical applications, and discusses the benefits and limitations.
The video serves as an excellent resource for traders looking to incorporate Renko charts into their automated strategies.
Frequently Asked Questions On Renko Charts
1. What are Renko charts used for?
Renko charts are a type of technical analysis tool used to visualize price movements in financial markets.
Unlike traditional candlestick or bar charts, Renko charts focus solely on price movement and ignore time.
This makes them ideal for traders who want to identify trends and key support/resistance levels without the distractions of noise that can occur during volatile trading periods.
Traders use Renko charts to identify trend direction and potential reversals by looking at patterns such as ascending/descending triangles or double/triple tops/bottoms.
They also use them to determine key support/resistance areas since these will often appear as clear horizontal lines across the chart.
2. Which timeframe is best for the Renko chart?
The best timeframe for Renko charts ultimately depends on the trader's individual trading style and goals.
Renko charts are a type of charting method used in technical analysis that display price trends using blocks or bricks instead of traditional candlesticks or bars.
Traders who prefer shorter-term trades may find that using smaller brick sizes, such as 1-2 pips, on a lower timeframe like a 5-minute chart can be effective.
This allows them to capture quick price movements and scalp small profits.
On the other hand, traders who prefer longer-term trades may opt for larger brick sizes, such as 10-20 pips, on higher time frames like daily or weekly charts.
This approach gives them a broader perspective of the market and allows them to ride bigger trends while minimizing noise.
3. Is Renko good for intraday?
Renko charts can be a great tool for intraday trading. Renko charts use price movement rather than time to create bricks, which helps traders identify trends and filter out market noise.
One advantage of using Renko charts is that they simplify the charting process by reducing the amount of clutter on your screen.
4. What is the best platform for Renko trading?
Renko trading is a popular approach to technical analysis that involves using price movements and chart patterns to identify potential trades.
When it comes to the best platform for Renko trading, there are several options available.
One of the most popular platforms for Renko traders is Tradetron. Tradetron offers a range of tools and features that can help traders analyze charts, track market trends, and execute trades quickly and efficiently.
It also allows users to customize their trading experience with various indicators, expert advisors, and other advanced features.
5. Is Renko good for scalping?
Renko can be a useful tool for scalping, but it depends on the trader's preferences and trading style.
Renko charts work by filtering out noise in the market and showing price movements based on a set brick size.
This can make it easier to identify trends and reversals.